Tongan vs Immigrants from Iraq Divorced or Separated
COMPARE
Tongan
Immigrants from Iraq
Divorced or Separated
Divorced or Separated Comparison
Tongans
Immigrants from Iraq
11.1%
DIVORCED OR SEPARATED
100.0/ 100
METRIC RATING
32nd/ 347
METRIC RANK
11.7%
DIVORCED OR SEPARATED
95.4/ 100
METRIC RATING
116th/ 347
METRIC RANK
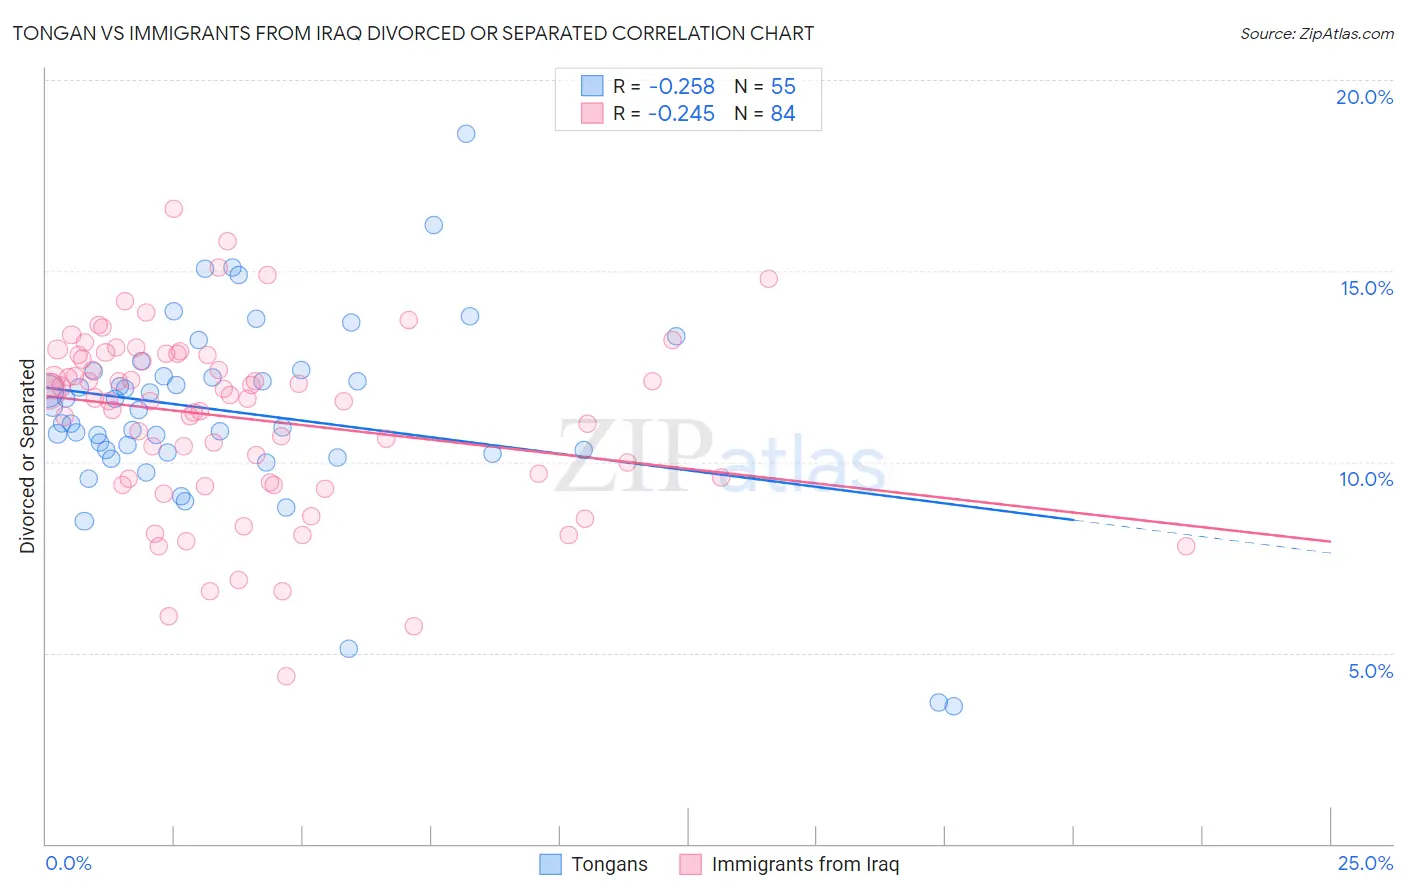
Tongan vs Immigrants from Iraq Divorced or Separated Correlation Chart
The statistical analysis conducted on geographies consisting of 102,897,047 people shows a weak negative correlation between the proportion of Tongans and percentage of population currently divorced or separated in the United States with a correlation coefficient (R) of -0.258 and weighted average of 11.1%. Similarly, the statistical analysis conducted on geographies consisting of 194,763,977 people shows a weak negative correlation between the proportion of Immigrants from Iraq and percentage of population currently divorced or separated in the United States with a correlation coefficient (R) of -0.245 and weighted average of 11.7%, a difference of 6.0%.
Divorced or Separated Correlation Summary
| Measurement | Tongan | Immigrants from Iraq |
| Minimum | 3.6% | 4.4% |
| Maximum | 18.6% | 16.6% |
| Range | 15.0% | 12.2% |
| Mean | 11.3% | 11.1% |
| Median | 11.4% | 11.7% |
| Interquartile 25% (IQ1) | 10.2% | 9.5% |
| Interquartile 75% (IQ3) | 12.4% | 12.8% |
| Interquartile Range (IQR) | 2.1% | 3.3% |
| Standard Deviation (Sample) | 2.6% | 2.4% |
| Standard Deviation (Population) | 2.6% | 2.4% |
Similar Demographics by Divorced or Separated
Demographics Similar to Tongans by Divorced or Separated
In terms of divorced or separated, the demographic groups most similar to Tongans are Egyptian (11.1%, a difference of 0.040%), Mongolian (11.1%, a difference of 0.080%), Immigrants from Uzbekistan (11.1%, a difference of 0.12%), Cambodian (11.1%, a difference of 0.20%), and Immigrants from Japan (11.1%, a difference of 0.25%).
| Demographics | Rating | Rank | Divorced or Separated |
| Iranians | 100.0 /100 | #25 | Exceptional 10.8% |
| Immigrants | Indonesia | 100.0 /100 | #26 | Exceptional 10.9% |
| Immigrants | Bangladesh | 100.0 /100 | #27 | Exceptional 11.0% |
| Immigrants | Malaysia | 100.0 /100 | #28 | Exceptional 11.0% |
| Armenians | 100.0 /100 | #29 | Exceptional 11.0% |
| Immigrants | Ireland | 100.0 /100 | #30 | Exceptional 11.0% |
| Mongolians | 100.0 /100 | #31 | Exceptional 11.1% |
| Tongans | 100.0 /100 | #32 | Exceptional 11.1% |
| Egyptians | 100.0 /100 | #33 | Exceptional 11.1% |
| Immigrants | Uzbekistan | 100.0 /100 | #34 | Exceptional 11.1% |
| Cambodians | 100.0 /100 | #35 | Exceptional 11.1% |
| Immigrants | Japan | 100.0 /100 | #36 | Exceptional 11.1% |
| Immigrants | Lebanon | 100.0 /100 | #37 | Exceptional 11.1% |
| Immigrants | Greece | 100.0 /100 | #38 | Exceptional 11.1% |
| Immigrants | Egypt | 100.0 /100 | #39 | Exceptional 11.1% |
Demographics Similar to Immigrants from Iraq by Divorced or Separated
In terms of divorced or separated, the demographic groups most similar to Immigrants from Iraq are Immigrants from Uganda (11.7%, a difference of 0.020%), Ecuadorian (11.7%, a difference of 0.020%), Lithuanian (11.7%, a difference of 0.060%), Syrian (11.7%, a difference of 0.060%), and Immigrants from Norway (11.7%, a difference of 0.12%).
| Demographics | Rating | Rank | Divorced or Separated |
| Immigrants | South Africa | 96.9 /100 | #109 | Exceptional 11.7% |
| Immigrants | Czechoslovakia | 96.9 /100 | #110 | Exceptional 11.7% |
| Immigrants | Spain | 96.8 /100 | #111 | Exceptional 11.7% |
| Immigrants | France | 96.6 /100 | #112 | Exceptional 11.7% |
| Estonians | 96.6 /100 | #113 | Exceptional 11.7% |
| Immigrants | Norway | 95.9 /100 | #114 | Exceptional 11.7% |
| Lithuanians | 95.7 /100 | #115 | Exceptional 11.7% |
| Immigrants | Iraq | 95.4 /100 | #116 | Exceptional 11.7% |
| Immigrants | Uganda | 95.3 /100 | #117 | Exceptional 11.7% |
| Ecuadorians | 95.3 /100 | #118 | Exceptional 11.7% |
| Syrians | 95.1 /100 | #119 | Exceptional 11.7% |
| Iraqis | 94.6 /100 | #120 | Exceptional 11.8% |
| Romanians | 94.5 /100 | #121 | Exceptional 11.8% |
| Menominee | 93.8 /100 | #122 | Exceptional 11.8% |
| Immigrants | Immigrants | 93.7 /100 | #123 | Exceptional 11.8% |