Immigrants from India vs Immigrants from Iraq Divorced or Separated
COMPARE
Immigrants from India
Immigrants from Iraq
Divorced or Separated
Divorced or Separated Comparison
Immigrants from India
Immigrants from Iraq
10.1%
DIVORCED OR SEPARATED
100.0/ 100
METRIC RATING
5th/ 347
METRIC RANK
11.7%
DIVORCED OR SEPARATED
95.4/ 100
METRIC RATING
116th/ 347
METRIC RANK
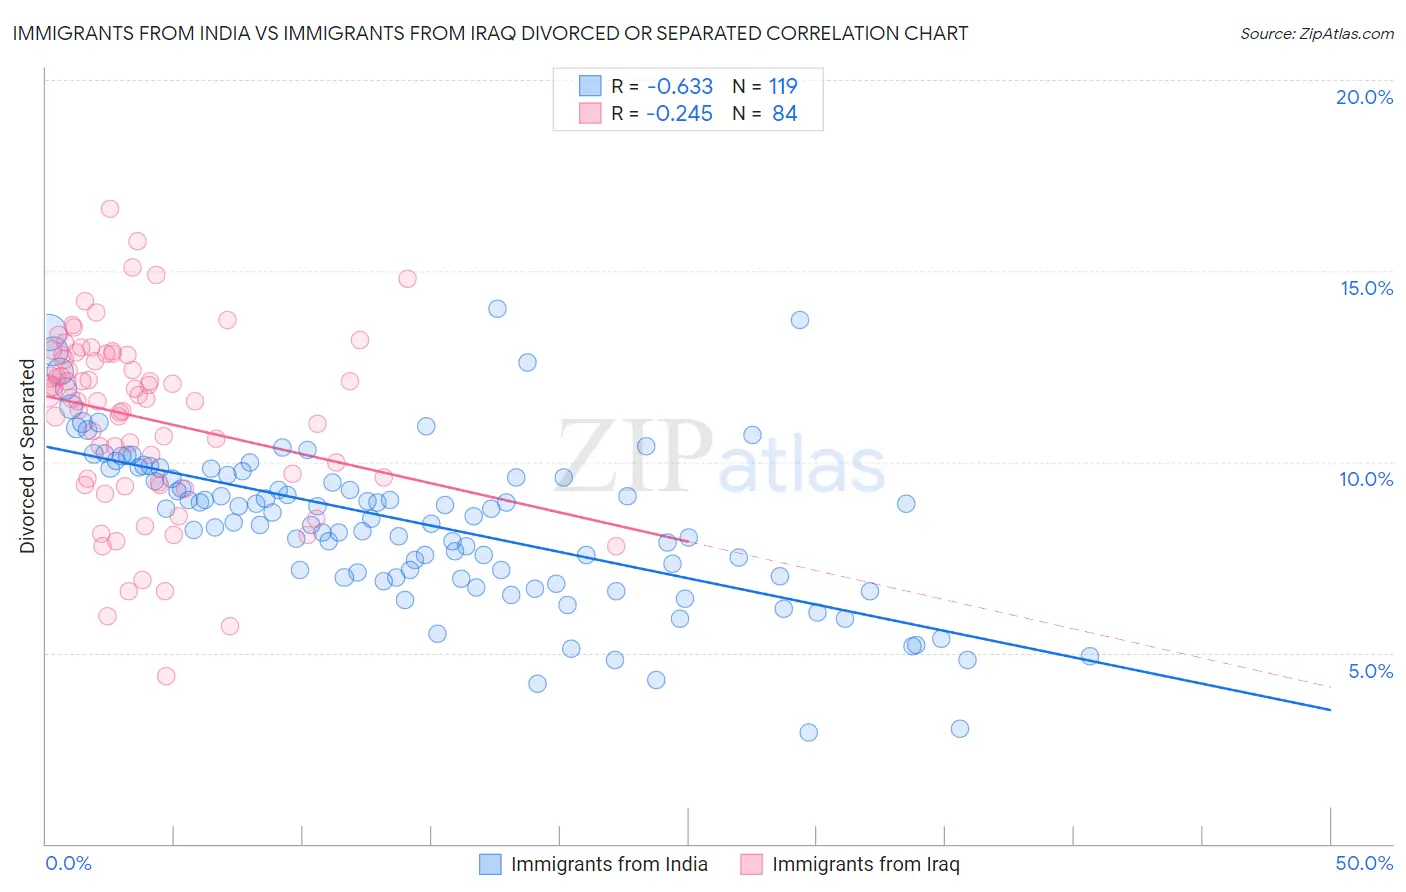
Immigrants from India vs Immigrants from Iraq Divorced or Separated Correlation Chart
The statistical analysis conducted on geographies consisting of 433,839,152 people shows a significant negative correlation between the proportion of Immigrants from India and percentage of population currently divorced or separated in the United States with a correlation coefficient (R) of -0.633 and weighted average of 10.1%. Similarly, the statistical analysis conducted on geographies consisting of 194,763,977 people shows a weak negative correlation between the proportion of Immigrants from Iraq and percentage of population currently divorced or separated in the United States with a correlation coefficient (R) of -0.245 and weighted average of 11.7%, a difference of 16.7%.
Divorced or Separated Correlation Summary
| Measurement | Immigrants from India | Immigrants from Iraq |
| Minimum | 2.9% | 4.4% |
| Maximum | 14.0% | 16.6% |
| Range | 11.1% | 12.2% |
| Mean | 8.4% | 11.1% |
| Median | 8.7% | 11.7% |
| Interquartile 25% (IQ1) | 7.0% | 9.5% |
| Interquartile 75% (IQ3) | 9.8% | 12.8% |
| Interquartile Range (IQR) | 2.8% | 3.3% |
| Standard Deviation (Sample) | 2.1% | 2.4% |
| Standard Deviation (Population) | 2.1% | 2.4% |
Similar Demographics by Divorced or Separated
Demographics Similar to Immigrants from India by Divorced or Separated
In terms of divorced or separated, the demographic groups most similar to Immigrants from India are Immigrants from China (10.0%, a difference of 0.23%), Immigrants from Hong Kong (10.0%, a difference of 0.96%), Indian (Asian) (10.2%, a difference of 1.3%), Thai (10.2%, a difference of 1.4%), and Filipino (9.9%, a difference of 1.5%).
| Demographics | Rating | Rank | Divorced or Separated |
| Immigrants | Taiwan | 100.0 /100 | #1 | Exceptional 9.8% |
| Filipinos | 100.0 /100 | #2 | Exceptional 9.9% |
| Immigrants | Hong Kong | 100.0 /100 | #3 | Exceptional 10.0% |
| Immigrants | China | 100.0 /100 | #4 | Exceptional 10.0% |
| Immigrants | India | 100.0 /100 | #5 | Exceptional 10.1% |
| Indians (Asian) | 100.0 /100 | #6 | Exceptional 10.2% |
| Thais | 100.0 /100 | #7 | Exceptional 10.2% |
| Immigrants | Eastern Asia | 100.0 /100 | #8 | Exceptional 10.2% |
| Yup'ik | 100.0 /100 | #9 | Exceptional 10.3% |
| Immigrants | Singapore | 100.0 /100 | #10 | Exceptional 10.3% |
| Immigrants | South Central Asia | 100.0 /100 | #11 | Exceptional 10.4% |
| Okinawans | 100.0 /100 | #12 | Exceptional 10.5% |
| Cypriots | 100.0 /100 | #13 | Exceptional 10.5% |
| Assyrians/Chaldeans/Syriacs | 100.0 /100 | #14 | Exceptional 10.6% |
| Immigrants | Armenia | 100.0 /100 | #15 | Exceptional 10.6% |
Demographics Similar to Immigrants from Iraq by Divorced or Separated
In terms of divorced or separated, the demographic groups most similar to Immigrants from Iraq are Immigrants from Uganda (11.7%, a difference of 0.020%), Ecuadorian (11.7%, a difference of 0.020%), Lithuanian (11.7%, a difference of 0.060%), Syrian (11.7%, a difference of 0.060%), and Immigrants from Norway (11.7%, a difference of 0.12%).
| Demographics | Rating | Rank | Divorced or Separated |
| Immigrants | South Africa | 96.9 /100 | #109 | Exceptional 11.7% |
| Immigrants | Czechoslovakia | 96.9 /100 | #110 | Exceptional 11.7% |
| Immigrants | Spain | 96.8 /100 | #111 | Exceptional 11.7% |
| Immigrants | France | 96.6 /100 | #112 | Exceptional 11.7% |
| Estonians | 96.6 /100 | #113 | Exceptional 11.7% |
| Immigrants | Norway | 95.9 /100 | #114 | Exceptional 11.7% |
| Lithuanians | 95.7 /100 | #115 | Exceptional 11.7% |
| Immigrants | Iraq | 95.4 /100 | #116 | Exceptional 11.7% |
| Immigrants | Uganda | 95.3 /100 | #117 | Exceptional 11.7% |
| Ecuadorians | 95.3 /100 | #118 | Exceptional 11.7% |
| Syrians | 95.1 /100 | #119 | Exceptional 11.7% |
| Iraqis | 94.6 /100 | #120 | Exceptional 11.8% |
| Romanians | 94.5 /100 | #121 | Exceptional 11.8% |
| Menominee | 93.8 /100 | #122 | Exceptional 11.8% |
| Immigrants | Immigrants | 93.7 /100 | #123 | Exceptional 11.8% |