Tongan vs Immigrants from Liberia Divorced or Separated
COMPARE
Tongan
Immigrants from Liberia
Divorced or Separated
Divorced or Separated Comparison
Tongans
Immigrants from Liberia
11.1%
DIVORCED OR SEPARATED
100.0/ 100
METRIC RATING
32nd/ 347
METRIC RANK
12.6%
DIVORCED OR SEPARATED
0.4/ 100
METRIC RATING
269th/ 347
METRIC RANK
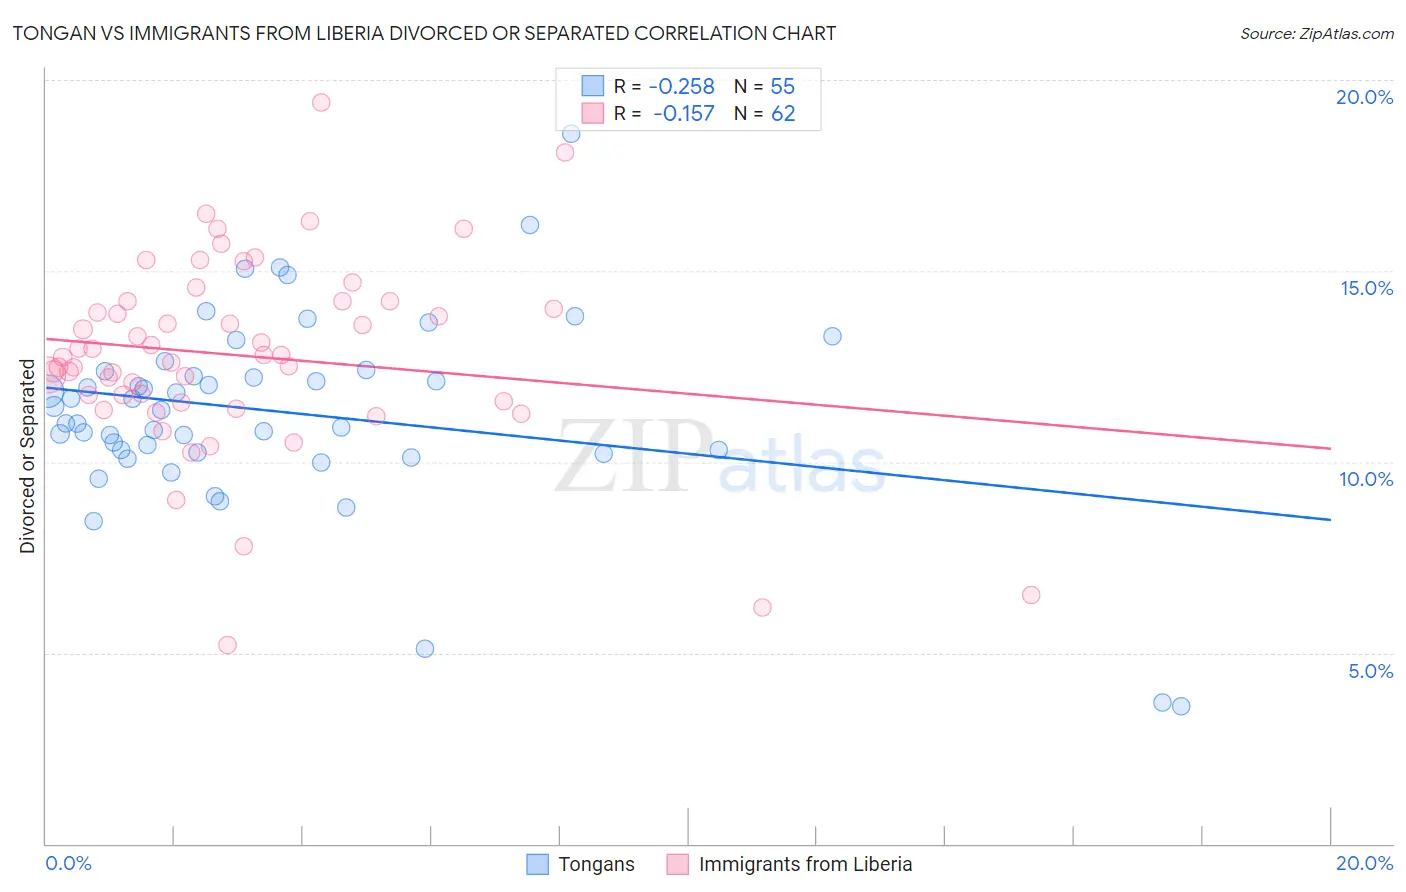
Tongan vs Immigrants from Liberia Divorced or Separated Correlation Chart
The statistical analysis conducted on geographies consisting of 102,897,047 people shows a weak negative correlation between the proportion of Tongans and percentage of population currently divorced or separated in the United States with a correlation coefficient (R) of -0.258 and weighted average of 11.1%. Similarly, the statistical analysis conducted on geographies consisting of 135,277,258 people shows a poor negative correlation between the proportion of Immigrants from Liberia and percentage of population currently divorced or separated in the United States with a correlation coefficient (R) of -0.157 and weighted average of 12.6%, a difference of 14.0%.
Divorced or Separated Correlation Summary
| Measurement | Tongan | Immigrants from Liberia |
| Minimum | 3.6% | 5.2% |
| Maximum | 18.6% | 19.4% |
| Range | 15.0% | 14.2% |
| Mean | 11.3% | 12.8% |
| Median | 11.4% | 12.8% |
| Interquartile 25% (IQ1) | 10.2% | 11.6% |
| Interquartile 75% (IQ3) | 12.4% | 14.2% |
| Interquartile Range (IQR) | 2.1% | 2.6% |
| Standard Deviation (Sample) | 2.6% | 2.5% |
| Standard Deviation (Population) | 2.6% | 2.5% |
Similar Demographics by Divorced or Separated
Demographics Similar to Tongans by Divorced or Separated
In terms of divorced or separated, the demographic groups most similar to Tongans are Egyptian (11.1%, a difference of 0.040%), Mongolian (11.1%, a difference of 0.080%), Immigrants from Uzbekistan (11.1%, a difference of 0.12%), Cambodian (11.1%, a difference of 0.20%), and Immigrants from Japan (11.1%, a difference of 0.25%).
| Demographics | Rating | Rank | Divorced or Separated |
| Iranians | 100.0 /100 | #25 | Exceptional 10.8% |
| Immigrants | Indonesia | 100.0 /100 | #26 | Exceptional 10.9% |
| Immigrants | Bangladesh | 100.0 /100 | #27 | Exceptional 11.0% |
| Immigrants | Malaysia | 100.0 /100 | #28 | Exceptional 11.0% |
| Armenians | 100.0 /100 | #29 | Exceptional 11.0% |
| Immigrants | Ireland | 100.0 /100 | #30 | Exceptional 11.0% |
| Mongolians | 100.0 /100 | #31 | Exceptional 11.1% |
| Tongans | 100.0 /100 | #32 | Exceptional 11.1% |
| Egyptians | 100.0 /100 | #33 | Exceptional 11.1% |
| Immigrants | Uzbekistan | 100.0 /100 | #34 | Exceptional 11.1% |
| Cambodians | 100.0 /100 | #35 | Exceptional 11.1% |
| Immigrants | Japan | 100.0 /100 | #36 | Exceptional 11.1% |
| Immigrants | Lebanon | 100.0 /100 | #37 | Exceptional 11.1% |
| Immigrants | Greece | 100.0 /100 | #38 | Exceptional 11.1% |
| Immigrants | Egypt | 100.0 /100 | #39 | Exceptional 11.1% |
Demographics Similar to Immigrants from Liberia by Divorced or Separated
In terms of divorced or separated, the demographic groups most similar to Immigrants from Liberia are Fijian (12.6%, a difference of 0.010%), Scottish (12.6%, a difference of 0.030%), White/Caucasian (12.6%, a difference of 0.070%), Immigrants from Senegal (12.6%, a difference of 0.080%), and English (12.6%, a difference of 0.090%).
| Demographics | Rating | Rank | Divorced or Separated |
| Basques | 0.5 /100 | #262 | Tragic 12.6% |
| Immigrants | Panama | 0.5 /100 | #263 | Tragic 12.6% |
| English | 0.5 /100 | #264 | Tragic 12.6% |
| Immigrants | Senegal | 0.5 /100 | #265 | Tragic 12.6% |
| Whites/Caucasians | 0.5 /100 | #266 | Tragic 12.6% |
| Scottish | 0.4 /100 | #267 | Tragic 12.6% |
| Fijians | 0.4 /100 | #268 | Tragic 12.6% |
| Immigrants | Liberia | 0.4 /100 | #269 | Tragic 12.6% |
| Ute | 0.4 /100 | #270 | Tragic 12.6% |
| Panamanians | 0.3 /100 | #271 | Tragic 12.7% |
| Immigrants | Middle Africa | 0.3 /100 | #272 | Tragic 12.7% |
| Immigrants | Micronesia | 0.3 /100 | #273 | Tragic 12.7% |
| Bermudans | 0.3 /100 | #274 | Tragic 12.7% |
| Central American Indians | 0.3 /100 | #275 | Tragic 12.7% |
| Spaniards | 0.2 /100 | #276 | Tragic 12.7% |