Tongan vs Immigrants from Sierra Leone Single Father Households
COMPARE
Tongan
Immigrants from Sierra Leone
Single Father Households
Single Father Households Comparison
Tongans
Immigrants from Sierra Leone
2.5%
SINGLE FATHER HOUSEHOLDS
1.5/ 100
METRIC RATING
255th/ 347
METRIC RANK
2.5%
SINGLE FATHER HOUSEHOLDS
5.8/ 100
METRIC RATING
238th/ 347
METRIC RANK
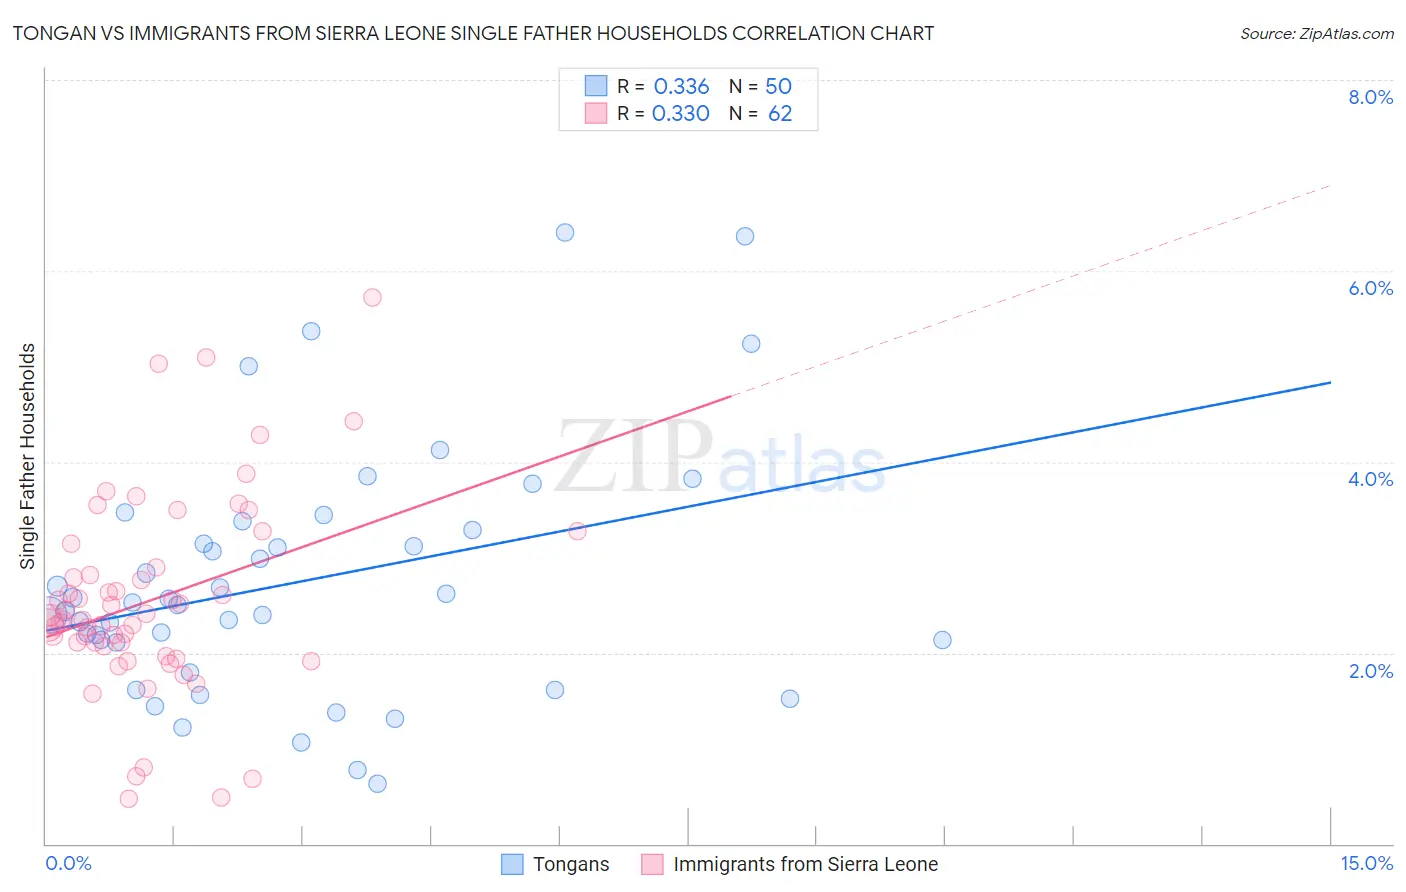
Tongan vs Immigrants from Sierra Leone Single Father Households Correlation Chart
The statistical analysis conducted on geographies consisting of 102,674,538 people shows a mild positive correlation between the proportion of Tongans and percentage of single father households in the United States with a correlation coefficient (R) of 0.336 and weighted average of 2.5%. Similarly, the statistical analysis conducted on geographies consisting of 101,470,770 people shows a mild positive correlation between the proportion of Immigrants from Sierra Leone and percentage of single father households in the United States with a correlation coefficient (R) of 0.330 and weighted average of 2.5%, a difference of 2.5%.
Single Father Households Correlation Summary
| Measurement | Tongan | Immigrants from Sierra Leone |
| Minimum | 0.63% | 0.47% |
| Maximum | 6.4% | 5.7% |
| Range | 5.8% | 5.3% |
| Mean | 2.7% | 2.5% |
| Median | 2.5% | 2.4% |
| Interquartile 25% (IQ1) | 2.1% | 2.1% |
| Interquartile 75% (IQ3) | 3.3% | 2.9% |
| Interquartile Range (IQR) | 1.2% | 0.83% |
| Standard Deviation (Sample) | 1.3% | 1.0% |
| Standard Deviation (Population) | 1.3% | 1.0% |
Demographics Similar to Tongans and Immigrants from Sierra Leone by Single Father Households
In terms of single father households, the demographic groups most similar to Tongans are Potawatomi (2.5%, a difference of 0.060%), Immigrants from Thailand (2.5%, a difference of 0.41%), Immigrants from Somalia (2.5%, a difference of 0.45%), Immigrants from Eritrea (2.5%, a difference of 0.52%), and Liberian (2.5%, a difference of 0.54%). Similarly, the demographic groups most similar to Immigrants from Sierra Leone are Immigrants from Oceania (2.5%, a difference of 0.010%), Sierra Leonean (2.5%, a difference of 0.030%), Cajun (2.5%, a difference of 0.080%), Immigrants from Dominica (2.5%, a difference of 0.37%), and Portuguese (2.5%, a difference of 0.63%).
| Demographics | Rating | Rank | Single Father Households |
| Cajuns | 6.1 /100 | #236 | Tragic 2.5% |
| Sierra Leoneans | 5.9 /100 | #237 | Tragic 2.5% |
| Immigrants | Sierra Leone | 5.8 /100 | #238 | Tragic 2.5% |
| Immigrants | Oceania | 5.8 /100 | #239 | Tragic 2.5% |
| Immigrants | Dominica | 4.8 /100 | #240 | Tragic 2.5% |
| Portuguese | 4.1 /100 | #241 | Tragic 2.5% |
| Osage | 4.1 /100 | #242 | Tragic 2.5% |
| Spaniards | 3.1 /100 | #243 | Tragic 2.5% |
| Immigrants | Middle Africa | 2.8 /100 | #244 | Tragic 2.5% |
| Basques | 2.5 /100 | #245 | Tragic 2.5% |
| Native Hawaiians | 2.5 /100 | #246 | Tragic 2.5% |
| Delaware | 2.5 /100 | #247 | Tragic 2.5% |
| Bahamians | 2.4 /100 | #248 | Tragic 2.5% |
| Immigrants | Cameroon | 2.3 /100 | #249 | Tragic 2.5% |
| Somalis | 2.1 /100 | #250 | Tragic 2.5% |
| Liberians | 2.0 /100 | #251 | Tragic 2.5% |
| Immigrants | Eritrea | 2.0 /100 | #252 | Tragic 2.5% |
| Immigrants | Somalia | 1.9 /100 | #253 | Tragic 2.5% |
| Immigrants | Thailand | 1.8 /100 | #254 | Tragic 2.5% |
| Tongans | 1.5 /100 | #255 | Tragic 2.5% |
| Potawatomi | 1.4 /100 | #256 | Tragic 2.5% |