Tongan vs Asian Single Father Households
COMPARE
Tongan
Asian
Single Father Households
Single Father Households Comparison
Tongans
Asians
2.5%
SINGLE FATHER HOUSEHOLDS
1.5/ 100
METRIC RATING
255th/ 347
METRIC RANK
2.1%
SINGLE FATHER HOUSEHOLDS
99.6/ 100
METRIC RATING
86th/ 347
METRIC RANK
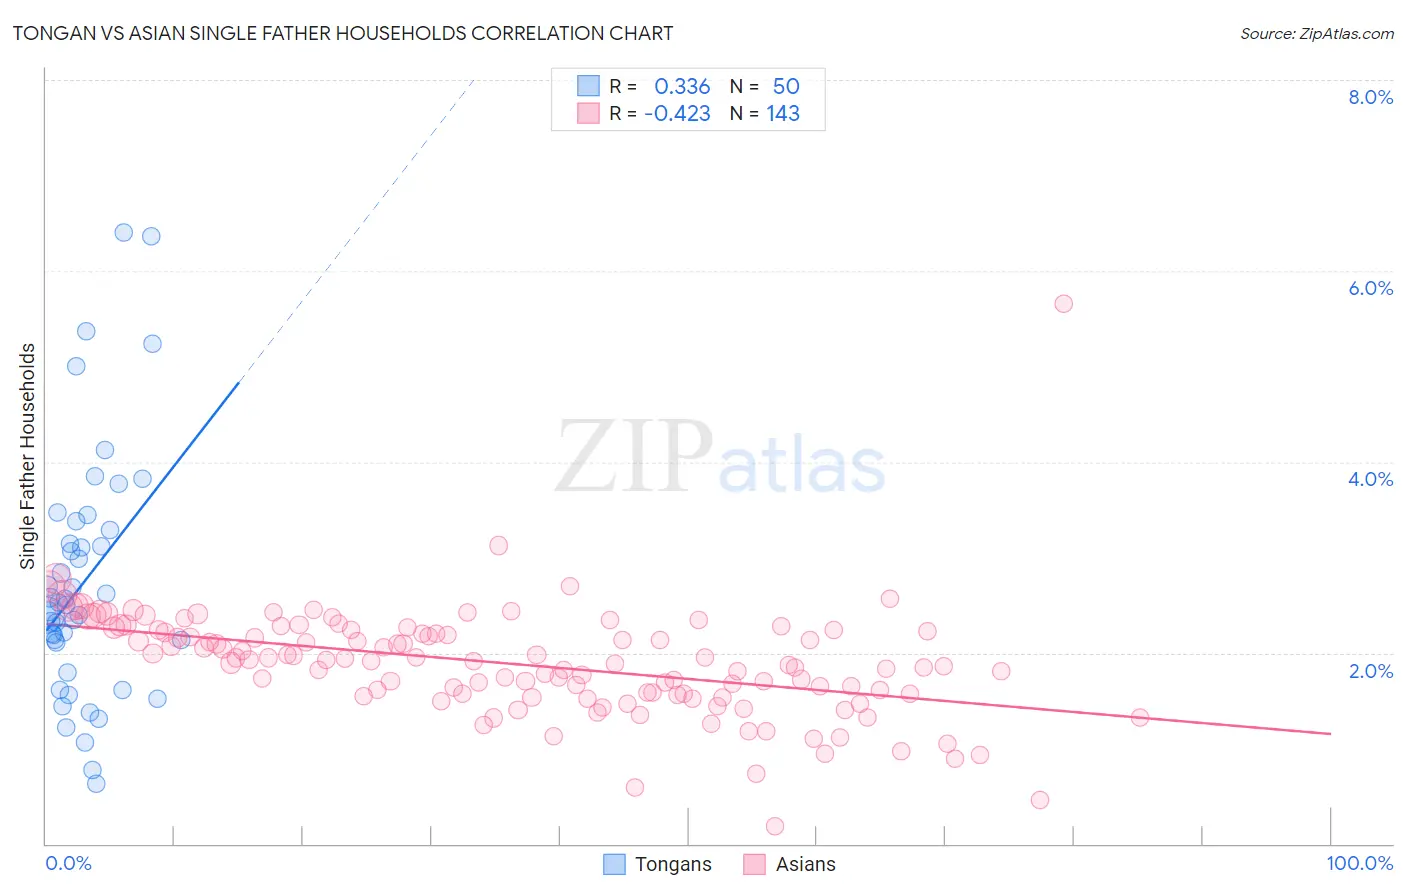
Tongan vs Asian Single Father Households Correlation Chart
The statistical analysis conducted on geographies consisting of 102,674,538 people shows a mild positive correlation between the proportion of Tongans and percentage of single father households in the United States with a correlation coefficient (R) of 0.336 and weighted average of 2.5%. Similarly, the statistical analysis conducted on geographies consisting of 539,811,945 people shows a moderate negative correlation between the proportion of Asians and percentage of single father households in the United States with a correlation coefficient (R) of -0.423 and weighted average of 2.1%, a difference of 20.0%.
Single Father Households Correlation Summary
| Measurement | Tongan | Asian |
| Minimum | 0.63% | 0.19% |
| Maximum | 6.4% | 5.7% |
| Range | 5.8% | 5.5% |
| Mean | 2.7% | 1.9% |
| Median | 2.5% | 1.9% |
| Interquartile 25% (IQ1) | 2.1% | 1.6% |
| Interquartile 75% (IQ3) | 3.3% | 2.2% |
| Interquartile Range (IQR) | 1.2% | 0.67% |
| Standard Deviation (Sample) | 1.3% | 0.58% |
| Standard Deviation (Population) | 1.3% | 0.58% |
Similar Demographics by Single Father Households
Demographics Similar to Tongans by Single Father Households
In terms of single father households, the demographic groups most similar to Tongans are Potawatomi (2.5%, a difference of 0.060%), Immigrants from Congo (2.5%, a difference of 0.34%), Immigrants from Thailand (2.5%, a difference of 0.41%), Spanish (2.5%, a difference of 0.43%), and Immigrants from Somalia (2.5%, a difference of 0.45%).
| Demographics | Rating | Rank | Single Father Households |
| Bahamians | 2.4 /100 | #248 | Tragic 2.5% |
| Immigrants | Cameroon | 2.3 /100 | #249 | Tragic 2.5% |
| Somalis | 2.1 /100 | #250 | Tragic 2.5% |
| Liberians | 2.0 /100 | #251 | Tragic 2.5% |
| Immigrants | Eritrea | 2.0 /100 | #252 | Tragic 2.5% |
| Immigrants | Somalia | 1.9 /100 | #253 | Tragic 2.5% |
| Immigrants | Thailand | 1.8 /100 | #254 | Tragic 2.5% |
| Tongans | 1.5 /100 | #255 | Tragic 2.5% |
| Potawatomi | 1.4 /100 | #256 | Tragic 2.5% |
| Immigrants | Congo | 1.2 /100 | #257 | Tragic 2.5% |
| Spanish | 1.1 /100 | #258 | Tragic 2.5% |
| Comanche | 1.0 /100 | #259 | Tragic 2.5% |
| Immigrants | Caribbean | 1.0 /100 | #260 | Tragic 2.5% |
| Immigrants | Belize | 0.9 /100 | #261 | Tragic 2.5% |
| Immigrants | Liberia | 0.8 /100 | #262 | Tragic 2.5% |
Demographics Similar to Asians by Single Father Households
In terms of single father households, the demographic groups most similar to Asians are Immigrants from Hungary (2.1%, a difference of 0.080%), Carpatho Rusyn (2.1%, a difference of 0.12%), Greek (2.1%, a difference of 0.42%), New Zealander (2.1%, a difference of 0.43%), and Armenian (2.1%, a difference of 0.48%).
| Demographics | Rating | Rank | Single Father Households |
| Immigrants | Asia | 99.7 /100 | #79 | Exceptional 2.1% |
| Immigrants | South Africa | 99.7 /100 | #80 | Exceptional 2.1% |
| Armenians | 99.7 /100 | #81 | Exceptional 2.1% |
| New Zealanders | 99.7 /100 | #82 | Exceptional 2.1% |
| Greeks | 99.7 /100 | #83 | Exceptional 2.1% |
| Carpatho Rusyns | 99.6 /100 | #84 | Exceptional 2.1% |
| Immigrants | Hungary | 99.6 /100 | #85 | Exceptional 2.1% |
| Asians | 99.6 /100 | #86 | Exceptional 2.1% |
| Lithuanians | 99.5 /100 | #87 | Exceptional 2.1% |
| Bhutanese | 99.5 /100 | #88 | Exceptional 2.1% |
| Immigrants | Armenia | 99.5 /100 | #89 | Exceptional 2.1% |
| Immigrants | Pakistan | 99.5 /100 | #90 | Exceptional 2.1% |
| Immigrants | Guyana | 99.4 /100 | #91 | Exceptional 2.1% |
| Romanians | 99.4 /100 | #92 | Exceptional 2.1% |
| Croatians | 99.3 /100 | #93 | Exceptional 2.1% |