Tongan vs South African Single Father Households
COMPARE
Tongan
South African
Single Father Households
Single Father Households Comparison
Tongans
South Africans
2.5%
SINGLE FATHER HOUSEHOLDS
1.5/ 100
METRIC RATING
255th/ 347
METRIC RANK
2.1%
SINGLE FATHER HOUSEHOLDS
99.1/ 100
METRIC RATING
99th/ 347
METRIC RANK
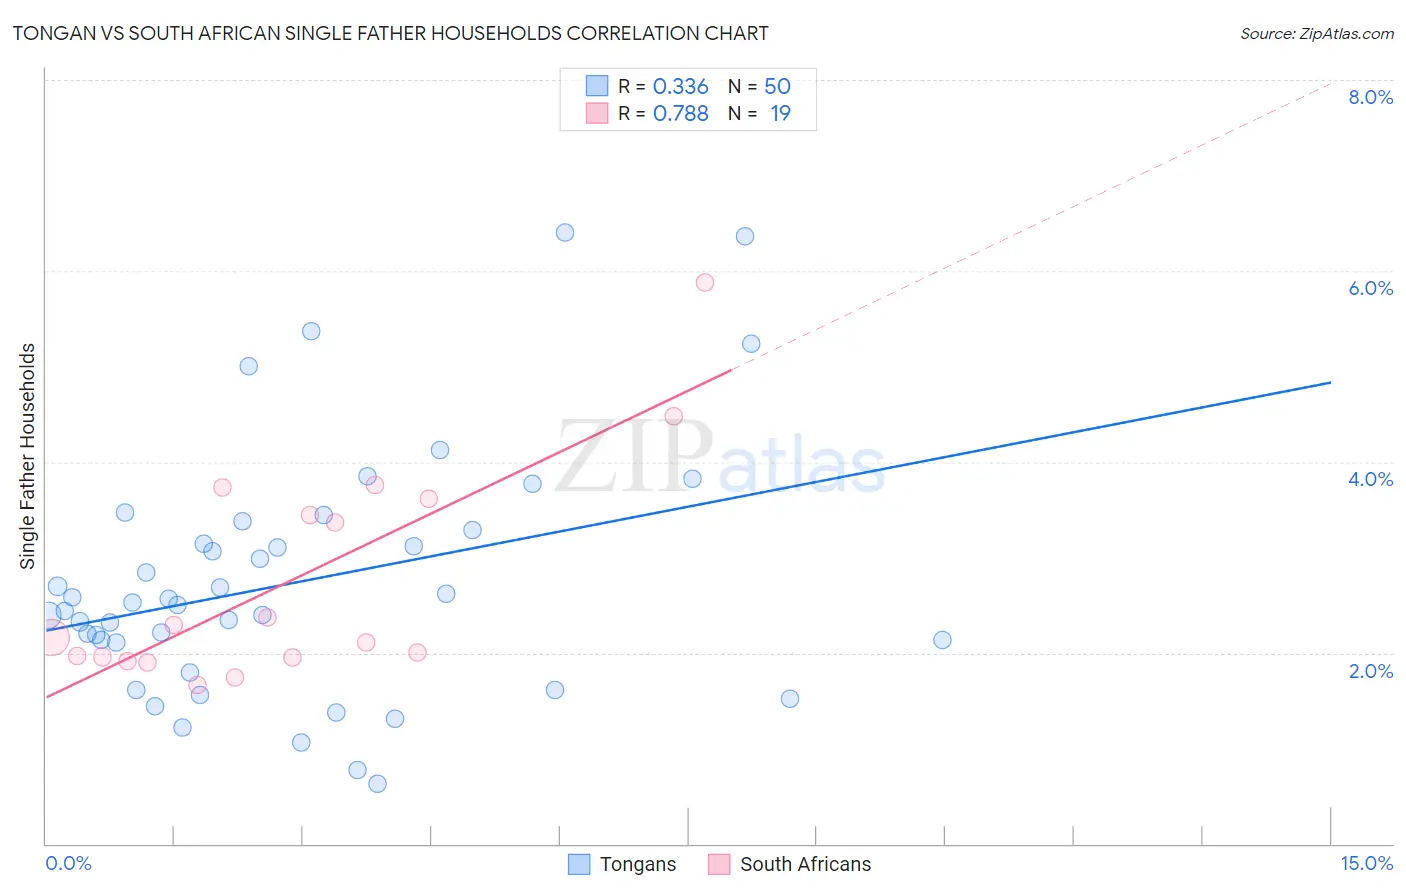
Tongan vs South African Single Father Households Correlation Chart
The statistical analysis conducted on geographies consisting of 102,674,538 people shows a mild positive correlation between the proportion of Tongans and percentage of single father households in the United States with a correlation coefficient (R) of 0.336 and weighted average of 2.5%. Similarly, the statistical analysis conducted on geographies consisting of 181,721,596 people shows a strong positive correlation between the proportion of South Africans and percentage of single father households in the United States with a correlation coefficient (R) of 0.788 and weighted average of 2.1%, a difference of 17.8%.
Single Father Households Correlation Summary
| Measurement | Tongan | South African |
| Minimum | 0.63% | 1.7% |
| Maximum | 6.4% | 5.9% |
| Range | 5.8% | 4.2% |
| Mean | 2.7% | 2.8% |
| Median | 2.5% | 2.2% |
| Interquartile 25% (IQ1) | 2.1% | 1.9% |
| Interquartile 75% (IQ3) | 3.3% | 3.6% |
| Interquartile Range (IQR) | 1.2% | 1.7% |
| Standard Deviation (Sample) | 1.3% | 1.1% |
| Standard Deviation (Population) | 1.3% | 1.1% |
Similar Demographics by Single Father Households
Demographics Similar to Tongans by Single Father Households
In terms of single father households, the demographic groups most similar to Tongans are Potawatomi (2.5%, a difference of 0.060%), Immigrants from Congo (2.5%, a difference of 0.34%), Immigrants from Thailand (2.5%, a difference of 0.41%), Spanish (2.5%, a difference of 0.43%), and Immigrants from Somalia (2.5%, a difference of 0.45%).
| Demographics | Rating | Rank | Single Father Households |
| Bahamians | 2.4 /100 | #248 | Tragic 2.5% |
| Immigrants | Cameroon | 2.3 /100 | #249 | Tragic 2.5% |
| Somalis | 2.1 /100 | #250 | Tragic 2.5% |
| Liberians | 2.0 /100 | #251 | Tragic 2.5% |
| Immigrants | Eritrea | 2.0 /100 | #252 | Tragic 2.5% |
| Immigrants | Somalia | 1.9 /100 | #253 | Tragic 2.5% |
| Immigrants | Thailand | 1.8 /100 | #254 | Tragic 2.5% |
| Tongans | 1.5 /100 | #255 | Tragic 2.5% |
| Potawatomi | 1.4 /100 | #256 | Tragic 2.5% |
| Immigrants | Congo | 1.2 /100 | #257 | Tragic 2.5% |
| Spanish | 1.1 /100 | #258 | Tragic 2.5% |
| Comanche | 1.0 /100 | #259 | Tragic 2.5% |
| Immigrants | Caribbean | 1.0 /100 | #260 | Tragic 2.5% |
| Immigrants | Belize | 0.9 /100 | #261 | Tragic 2.5% |
| Immigrants | Liberia | 0.8 /100 | #262 | Tragic 2.5% |
Demographics Similar to South Africans by Single Father Households
In terms of single father households, the demographic groups most similar to South Africans are Guyanese (2.1%, a difference of 0.040%), Immigrants from Northern Africa (2.1%, a difference of 0.15%), Immigrants from Moldova (2.1%, a difference of 0.17%), Arab (2.1%, a difference of 0.30%), and Immigrants from Western Europe (2.1%, a difference of 0.30%).
| Demographics | Rating | Rank | Single Father Households |
| Romanians | 99.4 /100 | #92 | Exceptional 2.1% |
| Croatians | 99.3 /100 | #93 | Exceptional 2.1% |
| Ukrainians | 99.3 /100 | #94 | Exceptional 2.1% |
| Bermudans | 99.2 /100 | #95 | Exceptional 2.1% |
| Arabs | 99.2 /100 | #96 | Exceptional 2.1% |
| Immigrants | Moldova | 99.1 /100 | #97 | Exceptional 2.1% |
| Guyanese | 99.1 /100 | #98 | Exceptional 2.1% |
| South Africans | 99.1 /100 | #99 | Exceptional 2.1% |
| Immigrants | Northern Africa | 99.0 /100 | #100 | Exceptional 2.1% |
| Immigrants | Western Europe | 98.9 /100 | #101 | Exceptional 2.1% |
| Argentineans | 98.9 /100 | #102 | Exceptional 2.1% |
| Lebanese | 98.9 /100 | #103 | Exceptional 2.1% |
| Alsatians | 98.9 /100 | #104 | Exceptional 2.1% |
| Palestinians | 98.6 /100 | #105 | Exceptional 2.2% |
| Immigrants | Southern Europe | 98.6 /100 | #106 | Exceptional 2.2% |