Tongan vs Immigrants from Denmark Nursery School
COMPARE
Tongan
Immigrants from Denmark
Nursery School
Nursery School Comparison
Tongans
Immigrants from Denmark
97.8%
NURSERY SCHOOL
4.3/ 100
METRIC RATING
221st/ 347
METRIC RANK
98.3%
NURSERY SCHOOL
99.1/ 100
METRIC RATING
84th/ 347
METRIC RANK
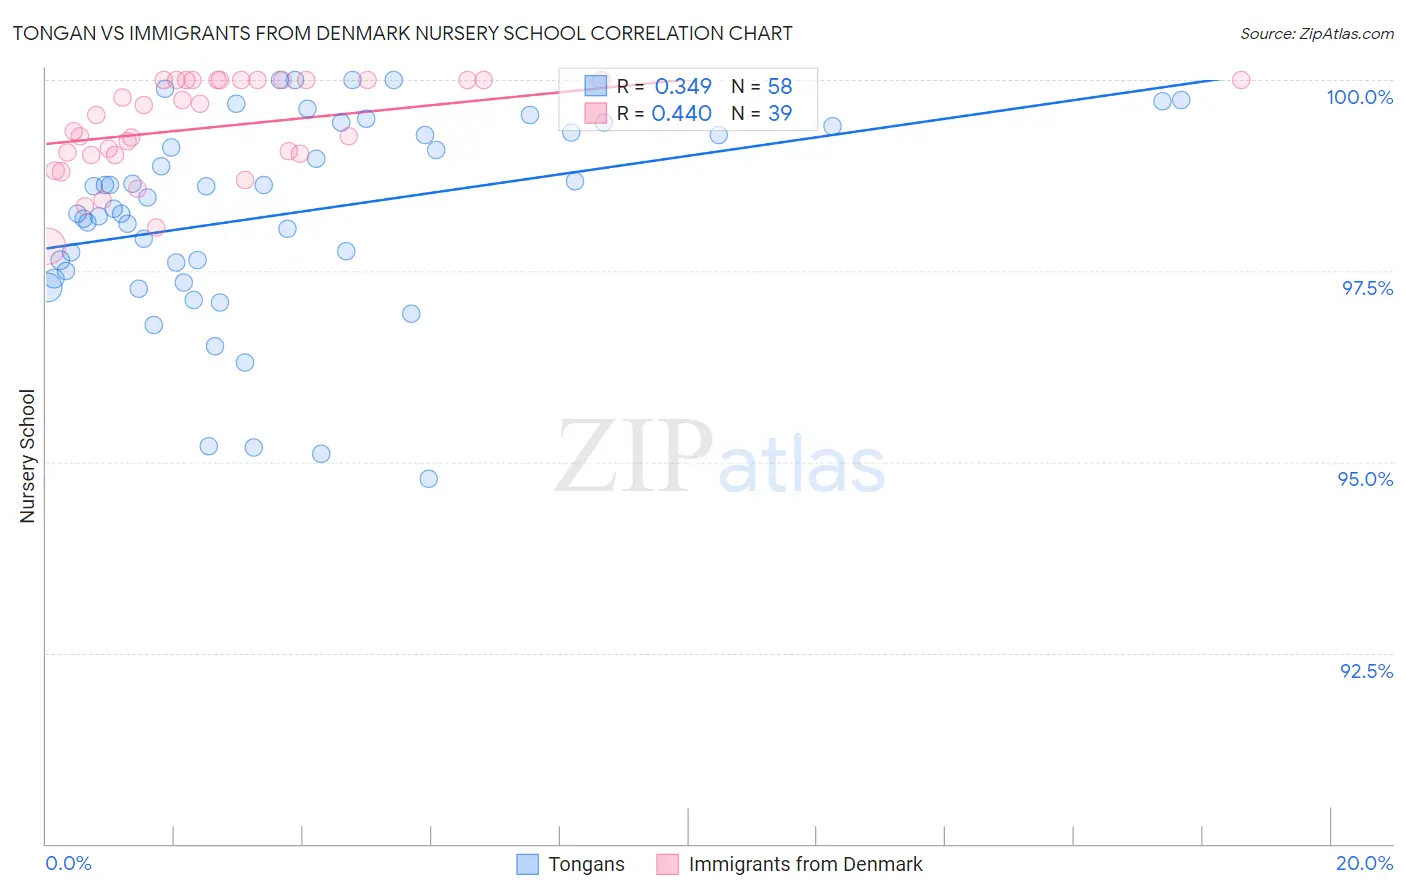
Tongan vs Immigrants from Denmark Nursery School Correlation Chart
The statistical analysis conducted on geographies consisting of 102,908,759 people shows a mild positive correlation between the proportion of Tongans and percentage of population with at least nursery school education in the United States with a correlation coefficient (R) of 0.349 and weighted average of 97.8%. Similarly, the statistical analysis conducted on geographies consisting of 136,428,049 people shows a moderate positive correlation between the proportion of Immigrants from Denmark and percentage of population with at least nursery school education in the United States with a correlation coefficient (R) of 0.440 and weighted average of 98.3%, a difference of 0.59%.
Nursery School Correlation Summary
| Measurement | Tongan | Immigrants from Denmark |
| Minimum | 94.8% | 97.8% |
| Maximum | 100.0% | 100.0% |
| Range | 5.2% | 2.2% |
| Mean | 98.2% | 99.4% |
| Median | 98.4% | 99.5% |
| Interquartile 25% (IQ1) | 97.5% | 99.0% |
| Interquartile 75% (IQ3) | 99.3% | 100.0% |
| Interquartile Range (IQR) | 1.8% | 0.98% |
| Standard Deviation (Sample) | 1.3% | 0.63% |
| Standard Deviation (Population) | 1.3% | 0.62% |
Similar Demographics by Nursery School
Demographics Similar to Tongans by Nursery School
In terms of nursery school, the demographic groups most similar to Tongans are Immigrants from Zaire (97.8%, a difference of 0.0%), Immigrants from Morocco (97.8%, a difference of 0.010%), Immigrants from Syria (97.7%, a difference of 0.010%), Immigrants from Sudan (97.7%, a difference of 0.010%), and Immigrants from Nepal (97.7%, a difference of 0.010%).
| Demographics | Rating | Rank | Nursery School |
| South American Indians | 8.0 /100 | #214 | Tragic 97.8% |
| Bahamians | 7.4 /100 | #215 | Tragic 97.8% |
| Uruguayans | 7.1 /100 | #216 | Tragic 97.8% |
| Samoans | 6.3 /100 | #217 | Tragic 97.8% |
| Immigrants | Panama | 5.3 /100 | #218 | Tragic 97.8% |
| Immigrants | Morocco | 5.1 /100 | #219 | Tragic 97.8% |
| Immigrants | Zaire | 4.4 /100 | #220 | Tragic 97.8% |
| Tongans | 4.3 /100 | #221 | Tragic 97.8% |
| Immigrants | Syria | 4.0 /100 | #222 | Tragic 97.7% |
| Immigrants | Sudan | 3.9 /100 | #223 | Tragic 97.7% |
| Immigrants | Nepal | 3.6 /100 | #224 | Tragic 97.7% |
| Immigrants | Costa Rica | 3.5 /100 | #225 | Tragic 97.7% |
| Iraqis | 3.5 /100 | #226 | Tragic 97.7% |
| Sub-Saharan Africans | 3.2 /100 | #227 | Tragic 97.7% |
| Sudanese | 3.2 /100 | #228 | Tragic 97.7% |
Demographics Similar to Immigrants from Denmark by Nursery School
In terms of nursery school, the demographic groups most similar to Immigrants from Denmark are Osage (98.3%, a difference of 0.0%), Immigrants from Sweden (98.3%, a difference of 0.0%), Shoshone (98.3%, a difference of 0.010%), Icelander (98.3%, a difference of 0.010%), and Potawatomi (98.3%, a difference of 0.010%).
| Demographics | Rating | Rank | Nursery School |
| Immigrants | Lithuania | 99.3 /100 | #77 | Exceptional 98.3% |
| Delaware | 99.3 /100 | #78 | Exceptional 98.3% |
| Immigrants | Belgium | 99.3 /100 | #79 | Exceptional 98.3% |
| Shoshone | 99.3 /100 | #80 | Exceptional 98.3% |
| Icelanders | 99.2 /100 | #81 | Exceptional 98.3% |
| Potawatomi | 99.2 /100 | #82 | Exceptional 98.3% |
| Osage | 99.1 /100 | #83 | Exceptional 98.3% |
| Immigrants | Denmark | 99.1 /100 | #84 | Exceptional 98.3% |
| Immigrants | Sweden | 99.1 /100 | #85 | Exceptional 98.3% |
| Immigrants | Australia | 99.0 /100 | #86 | Exceptional 98.3% |
| Hopi | 98.9 /100 | #87 | Exceptional 98.3% |
| Ukrainians | 98.9 /100 | #88 | Exceptional 98.3% |
| Immigrants | South Africa | 98.8 /100 | #89 | Exceptional 98.3% |
| Immigrants | Western Europe | 98.8 /100 | #90 | Exceptional 98.3% |
| Zimbabweans | 98.8 /100 | #91 | Exceptional 98.3% |