Cuban vs Immigrants from Africa Single Father Households
COMPARE
Cuban
Immigrants from Africa
Single Father Households
Single Father Households Comparison
Cubans
Immigrants from Africa
2.6%
SINGLE FATHER HOUSEHOLDS
0.3/ 100
METRIC RATING
269th/ 347
METRIC RANK
2.4%
SINGLE FATHER HOUSEHOLDS
30.0/ 100
METRIC RATING
191st/ 347
METRIC RANK
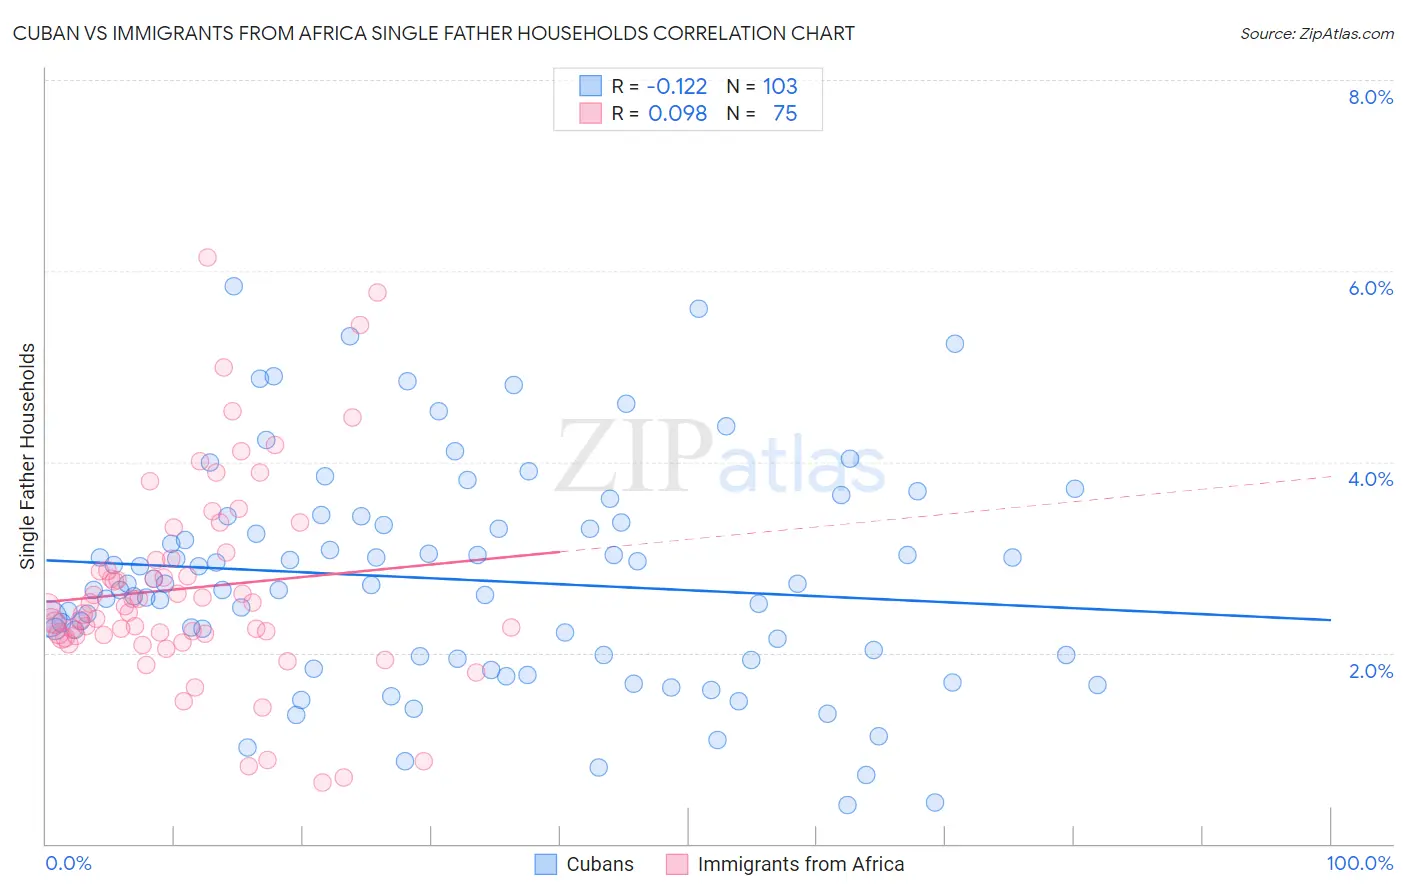
Cuban vs Immigrants from Africa Single Father Households Correlation Chart
The statistical analysis conducted on geographies consisting of 444,378,615 people shows a poor negative correlation between the proportion of Cubans and percentage of single father households in the United States with a correlation coefficient (R) of -0.122 and weighted average of 2.6%. Similarly, the statistical analysis conducted on geographies consisting of 464,041,277 people shows a slight positive correlation between the proportion of Immigrants from Africa and percentage of single father households in the United States with a correlation coefficient (R) of 0.098 and weighted average of 2.4%, a difference of 9.1%.
Single Father Households Correlation Summary
| Measurement | Cuban | Immigrants from Africa |
| Minimum | 0.41% | 0.64% |
| Maximum | 5.8% | 6.1% |
| Range | 5.4% | 5.5% |
| Mean | 2.8% | 2.7% |
| Median | 2.7% | 2.5% |
| Interquartile 25% (IQ1) | 2.0% | 2.2% |
| Interquartile 75% (IQ3) | 3.4% | 3.0% |
| Interquartile Range (IQR) | 1.4% | 0.81% |
| Standard Deviation (Sample) | 1.1% | 1.1% |
| Standard Deviation (Population) | 1.1% | 1.1% |
Similar Demographics by Single Father Households
Demographics Similar to Cubans by Single Father Households
In terms of single father households, the demographic groups most similar to Cubans are Seminole (2.6%, a difference of 0.14%), Haitian (2.6%, a difference of 0.34%), Guamanian/Chamorro (2.6%, a difference of 0.38%), Creek (2.6%, a difference of 0.50%), and Belizean (2.6%, a difference of 0.50%).
| Demographics | Rating | Rank | Single Father Households |
| Immigrants | Liberia | 0.8 /100 | #262 | Tragic 2.5% |
| Dominicans | 0.8 /100 | #263 | Tragic 2.5% |
| Indonesians | 0.5 /100 | #264 | Tragic 2.6% |
| Immigrants | Micronesia | 0.5 /100 | #265 | Tragic 2.6% |
| French American Indians | 0.5 /100 | #266 | Tragic 2.6% |
| Guamanians/Chamorros | 0.4 /100 | #267 | Tragic 2.6% |
| Haitians | 0.4 /100 | #268 | Tragic 2.6% |
| Cubans | 0.3 /100 | #269 | Tragic 2.6% |
| Seminole | 0.3 /100 | #270 | Tragic 2.6% |
| Creek | 0.2 /100 | #271 | Tragic 2.6% |
| Belizeans | 0.2 /100 | #272 | Tragic 2.6% |
| Iroquois | 0.2 /100 | #273 | Tragic 2.6% |
| Puerto Ricans | 0.2 /100 | #274 | Tragic 2.6% |
| Immigrants | Dominican Republic | 0.2 /100 | #275 | Tragic 2.6% |
| Immigrants | Haiti | 0.1 /100 | #276 | Tragic 2.6% |
Demographics Similar to Immigrants from Africa by Single Father Households
In terms of single father households, the demographic groups most similar to Immigrants from Africa are Immigrants from Sudan (2.4%, a difference of 0.010%), Uruguayan (2.4%, a difference of 0.030%), Panamanian (2.4%, a difference of 0.030%), Immigrants from Philippines (2.4%, a difference of 0.11%), and U.S. Virgin Islander (2.4%, a difference of 0.15%).
| Demographics | Rating | Rank | Single Father Households |
| Sri Lankans | 41.8 /100 | #184 | Average 2.4% |
| Nigerians | 41.0 /100 | #185 | Average 2.4% |
| Immigrants | Bosnia and Herzegovina | 40.4 /100 | #186 | Average 2.4% |
| Immigrants | Colombia | 34.0 /100 | #187 | Fair 2.4% |
| Hmong | 33.0 /100 | #188 | Fair 2.4% |
| U.S. Virgin Islanders | 31.8 /100 | #189 | Fair 2.4% |
| French | 31.7 /100 | #190 | Fair 2.4% |
| Immigrants | Africa | 30.0 /100 | #191 | Fair 2.4% |
| Immigrants | Sudan | 29.8 /100 | #192 | Fair 2.4% |
| Uruguayans | 29.7 /100 | #193 | Fair 2.4% |
| Panamanians | 29.6 /100 | #194 | Fair 2.4% |
| Immigrants | Philippines | 28.7 /100 | #195 | Fair 2.4% |
| Kenyans | 28.0 /100 | #196 | Fair 2.4% |
| Germans | 28.0 /100 | #197 | Fair 2.4% |
| Scandinavians | 27.4 /100 | #198 | Fair 2.4% |