Immigrants from Nepal vs Immigrants from Africa Single Father Households
COMPARE
Immigrants from Nepal
Immigrants from Africa
Single Father Households
Single Father Households Comparison
Immigrants from Nepal
Immigrants from Africa
2.2%
SINGLE FATHER HOUSEHOLDS
92.1/ 100
METRIC RATING
143rd/ 347
METRIC RANK
2.4%
SINGLE FATHER HOUSEHOLDS
30.0/ 100
METRIC RATING
191st/ 347
METRIC RANK
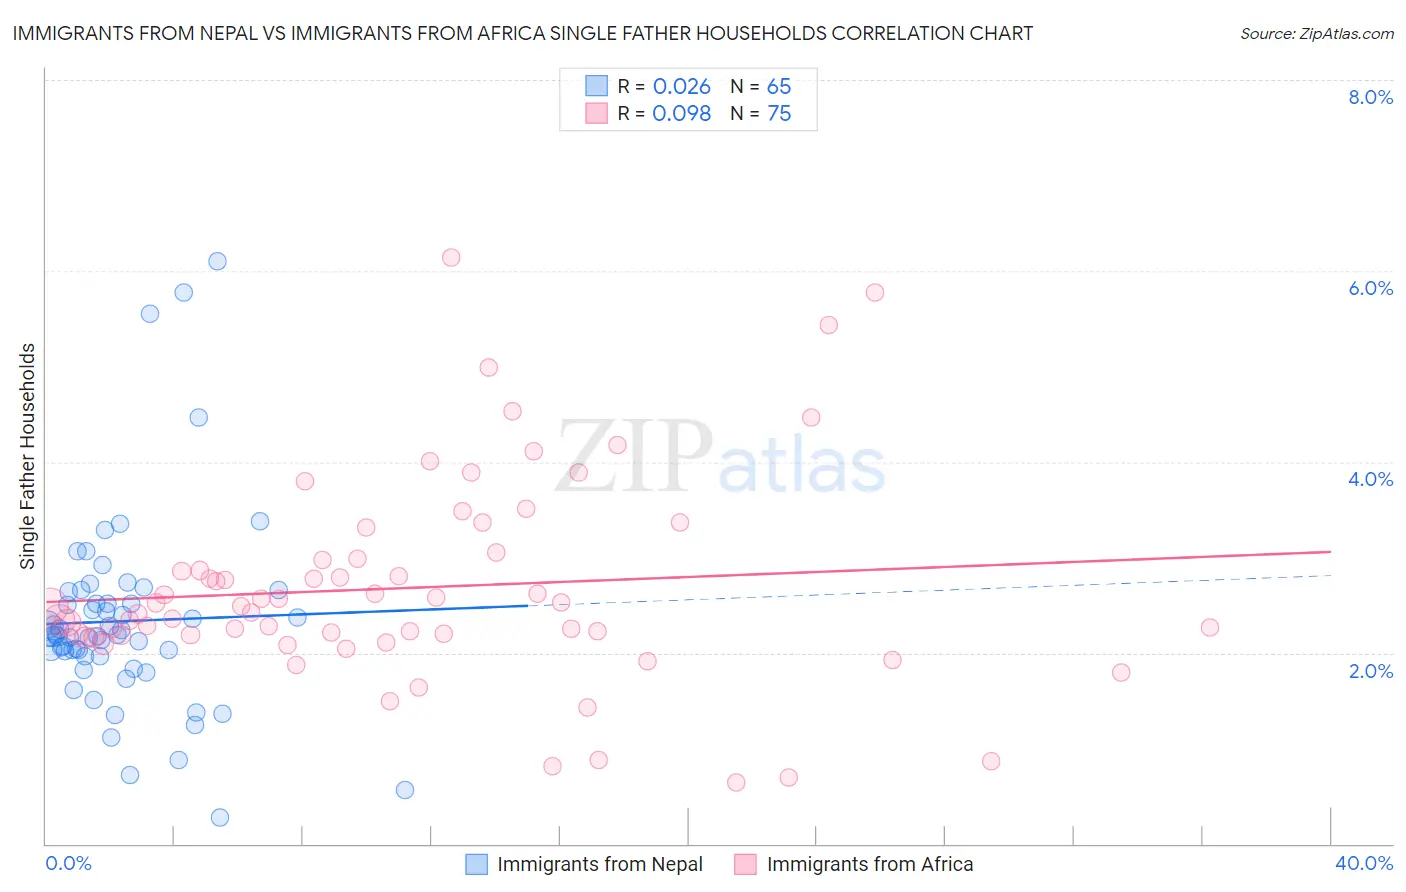
Immigrants from Nepal vs Immigrants from Africa Single Father Households Correlation Chart
The statistical analysis conducted on geographies consisting of 186,164,733 people shows no correlation between the proportion of Immigrants from Nepal and percentage of single father households in the United States with a correlation coefficient (R) of 0.026 and weighted average of 2.2%. Similarly, the statistical analysis conducted on geographies consisting of 464,041,277 people shows a slight positive correlation between the proportion of Immigrants from Africa and percentage of single father households in the United States with a correlation coefficient (R) of 0.098 and weighted average of 2.4%, a difference of 6.4%.
Single Father Households Correlation Summary
| Measurement | Immigrants from Nepal | Immigrants from Africa |
| Minimum | 0.28% | 0.64% |
| Maximum | 6.1% | 6.1% |
| Range | 5.8% | 5.5% |
| Mean | 2.3% | 2.7% |
| Median | 2.2% | 2.5% |
| Interquartile 25% (IQ1) | 2.0% | 2.2% |
| Interquartile 75% (IQ3) | 2.6% | 3.0% |
| Interquartile Range (IQR) | 0.61% | 0.81% |
| Standard Deviation (Sample) | 1.0% | 1.1% |
| Standard Deviation (Population) | 1.0% | 1.1% |
Similar Demographics by Single Father Households
Demographics Similar to Immigrants from Nepal by Single Father Households
In terms of single father households, the demographic groups most similar to Immigrants from Nepal are Luxembourger (2.2%, a difference of 0.060%), Laotian (2.2%, a difference of 0.10%), Brazilian (2.2%, a difference of 0.19%), British (2.2%, a difference of 0.19%), and Slovak (2.2%, a difference of 0.34%).
| Demographics | Rating | Rank | Single Father Households |
| Chileans | 94.5 /100 | #136 | Exceptional 2.2% |
| Austrians | 94.2 /100 | #137 | Exceptional 2.2% |
| West Indians | 94.1 /100 | #138 | Exceptional 2.2% |
| Brazilians | 92.8 /100 | #139 | Exceptional 2.2% |
| British | 92.8 /100 | #140 | Exceptional 2.2% |
| Laotians | 92.5 /100 | #141 | Exceptional 2.2% |
| Luxembourgers | 92.3 /100 | #142 | Exceptional 2.2% |
| Immigrants | Nepal | 92.1 /100 | #143 | Exceptional 2.2% |
| Slovaks | 90.7 /100 | #144 | Exceptional 2.2% |
| Immigrants | Zimbabwe | 90.2 /100 | #145 | Exceptional 2.2% |
| Northern Europeans | 89.8 /100 | #146 | Excellent 2.2% |
| Slavs | 88.9 /100 | #147 | Excellent 2.2% |
| South American Indians | 88.5 /100 | #148 | Excellent 2.3% |
| Senegalese | 88.4 /100 | #149 | Excellent 2.3% |
| Venezuelans | 86.2 /100 | #150 | Excellent 2.3% |
Demographics Similar to Immigrants from Africa by Single Father Households
In terms of single father households, the demographic groups most similar to Immigrants from Africa are Immigrants from Sudan (2.4%, a difference of 0.010%), Uruguayan (2.4%, a difference of 0.030%), Panamanian (2.4%, a difference of 0.030%), Immigrants from Philippines (2.4%, a difference of 0.11%), and U.S. Virgin Islander (2.4%, a difference of 0.15%).
| Demographics | Rating | Rank | Single Father Households |
| Sri Lankans | 41.8 /100 | #184 | Average 2.4% |
| Nigerians | 41.0 /100 | #185 | Average 2.4% |
| Immigrants | Bosnia and Herzegovina | 40.4 /100 | #186 | Average 2.4% |
| Immigrants | Colombia | 34.0 /100 | #187 | Fair 2.4% |
| Hmong | 33.0 /100 | #188 | Fair 2.4% |
| U.S. Virgin Islanders | 31.8 /100 | #189 | Fair 2.4% |
| French | 31.7 /100 | #190 | Fair 2.4% |
| Immigrants | Africa | 30.0 /100 | #191 | Fair 2.4% |
| Immigrants | Sudan | 29.8 /100 | #192 | Fair 2.4% |
| Uruguayans | 29.7 /100 | #193 | Fair 2.4% |
| Panamanians | 29.6 /100 | #194 | Fair 2.4% |
| Immigrants | Philippines | 28.7 /100 | #195 | Fair 2.4% |
| Kenyans | 28.0 /100 | #196 | Fair 2.4% |
| Germans | 28.0 /100 | #197 | Fair 2.4% |
| Scandinavians | 27.4 /100 | #198 | Fair 2.4% |