Mexican American Indian vs Bolivian Family Households with Children
COMPARE
Mexican American Indian
Bolivian
Family Households with Children
Family Households with Children Comparison
Mexican American Indians
Bolivians
29.7%
FAMILY HOUSEHOLDS WITH CHILDREN
100.0/ 100
METRIC RATING
23rd/ 347
METRIC RANK
29.5%
FAMILY HOUSEHOLDS WITH CHILDREN
100.0/ 100
METRIC RATING
29th/ 347
METRIC RANK
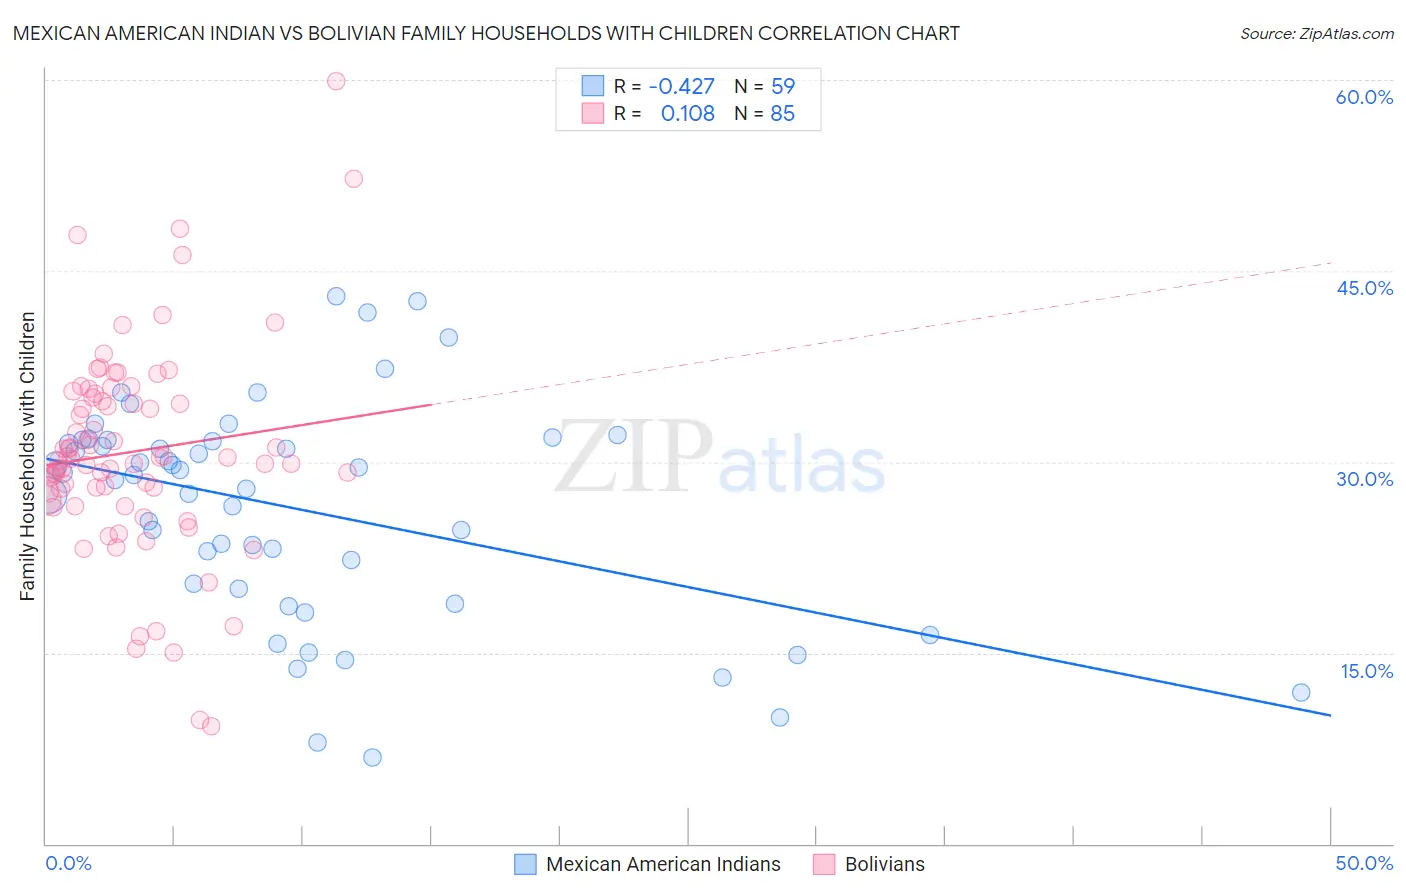
Mexican American Indian vs Bolivian Family Households with Children Correlation Chart
The statistical analysis conducted on geographies consisting of 317,453,959 people shows a moderate negative correlation between the proportion of Mexican American Indians and percentage of family households with children in the United States with a correlation coefficient (R) of -0.427 and weighted average of 29.7%. Similarly, the statistical analysis conducted on geographies consisting of 184,562,629 people shows a poor positive correlation between the proportion of Bolivians and percentage of family households with children in the United States with a correlation coefficient (R) of 0.108 and weighted average of 29.5%, a difference of 0.83%.
Family Households with Children Correlation Summary
| Measurement | Mexican American Indian | Bolivian |
| Minimum | 6.8% | 9.2% |
| Maximum | 43.0% | 59.9% |
| Range | 36.2% | 50.7% |
| Mean | 26.3% | 30.8% |
| Median | 29.0% | 30.3% |
| Interquartile 25% (IQ1) | 20.1% | 27.3% |
| Interquartile 75% (IQ3) | 31.7% | 35.2% |
| Interquartile Range (IQR) | 11.7% | 7.8% |
| Standard Deviation (Sample) | 8.6% | 8.2% |
| Standard Deviation (Population) | 8.5% | 8.2% |
Demographics Similar to Mexican American Indians and Bolivians by Family Households with Children
In terms of family households with children, the demographic groups most similar to Mexican American Indians are Guamanian/Chamorro (29.7%, a difference of 0.10%), Immigrants from Latin America (29.7%, a difference of 0.20%), Malaysian (29.8%, a difference of 0.27%), Immigrants from Laos (29.8%, a difference of 0.31%), and Immigrants from El Salvador (29.8%, a difference of 0.35%). Similarly, the demographic groups most similar to Bolivians are Samoan (29.5%, a difference of 0.0%), Yuman (29.5%, a difference of 0.030%), Immigrants from Vietnam (29.5%, a difference of 0.16%), Japanese (29.4%, a difference of 0.18%), and Sri Lankan (29.5%, a difference of 0.19%).
| Demographics | Rating | Rank | Family Households with Children |
| Immigrants | Afghanistan | 100.0 /100 | #16 | Exceptional 30.0% |
| Hispanics or Latinos | 100.0 /100 | #17 | Exceptional 29.9% |
| Salvadorans | 100.0 /100 | #18 | Exceptional 29.9% |
| Alaska Natives | 100.0 /100 | #19 | Exceptional 29.9% |
| Immigrants | El Salvador | 100.0 /100 | #20 | Exceptional 29.8% |
| Immigrants | Laos | 100.0 /100 | #21 | Exceptional 29.8% |
| Malaysians | 100.0 /100 | #22 | Exceptional 29.8% |
| Mexican American Indians | 100.0 /100 | #23 | Exceptional 29.7% |
| Guamanians/Chamorros | 100.0 /100 | #24 | Exceptional 29.7% |
| Immigrants | Latin America | 100.0 /100 | #25 | Exceptional 29.7% |
| Sri Lankans | 100.0 /100 | #26 | Exceptional 29.5% |
| Immigrants | Vietnam | 100.0 /100 | #27 | Exceptional 29.5% |
| Samoans | 100.0 /100 | #28 | Exceptional 29.5% |
| Bolivians | 100.0 /100 | #29 | Exceptional 29.5% |
| Yuman | 100.0 /100 | #30 | Exceptional 29.5% |
| Japanese | 100.0 /100 | #31 | Exceptional 29.4% |
| Immigrants | Yemen | 100.0 /100 | #32 | Exceptional 29.4% |
| Venezuelans | 100.0 /100 | #33 | Exceptional 29.4% |
| Immigrants | Bolivia | 100.0 /100 | #34 | Exceptional 29.3% |
| Immigrants | Sierra Leone | 100.0 /100 | #35 | Exceptional 29.3% |
| Immigrants | Venezuela | 100.0 /100 | #36 | Exceptional 29.3% |