Thai vs Immigrants from Zaire Single Father Households
COMPARE
Thai
Immigrants from Zaire
Single Father Households
Single Father Households Comparison
Thais
Immigrants from Zaire
1.9%
SINGLE FATHER HOUSEHOLDS
100.0/ 100
METRIC RATING
20th/ 347
METRIC RANK
2.4%
SINGLE FATHER HOUSEHOLDS
8.6/ 100
METRIC RATING
229th/ 347
METRIC RANK
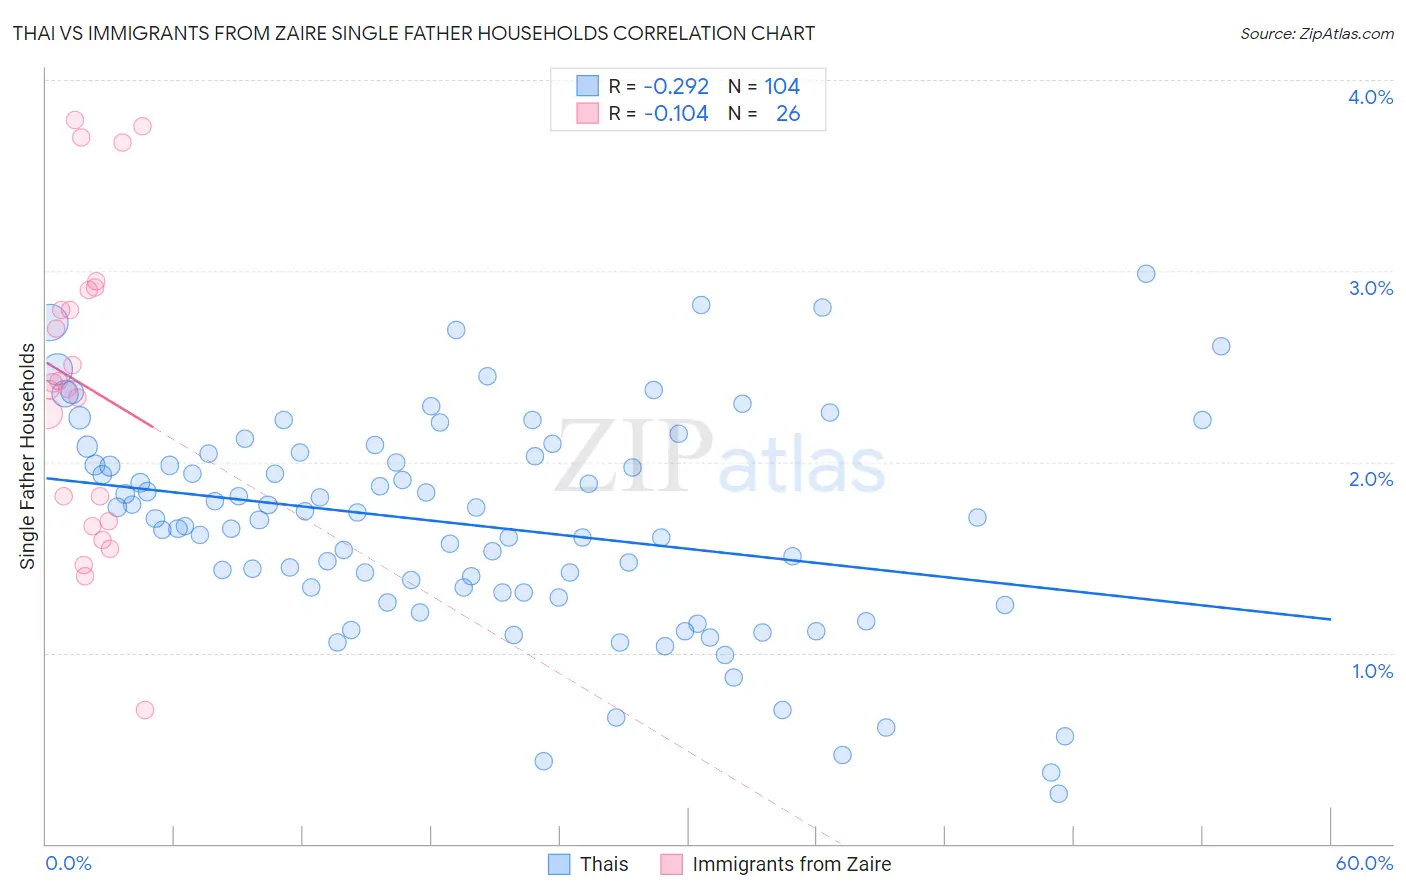
Thai vs Immigrants from Zaire Single Father Households Correlation Chart
The statistical analysis conducted on geographies consisting of 470,214,576 people shows a weak negative correlation between the proportion of Thais and percentage of single father households in the United States with a correlation coefficient (R) of -0.292 and weighted average of 1.9%. Similarly, the statistical analysis conducted on geographies consisting of 107,136,066 people shows a poor negative correlation between the proportion of Immigrants from Zaire and percentage of single father households in the United States with a correlation coefficient (R) of -0.104 and weighted average of 2.4%, a difference of 26.8%.
Single Father Households Correlation Summary
| Measurement | Thai | Immigrants from Zaire |
| Minimum | 0.26% | 0.70% |
| Maximum | 3.0% | 3.8% |
| Range | 2.7% | 3.1% |
| Mean | 1.7% | 2.4% |
| Median | 1.7% | 2.4% |
| Interquartile 25% (IQ1) | 1.3% | 1.7% |
| Interquartile 75% (IQ3) | 2.0% | 2.9% |
| Interquartile Range (IQR) | 0.72% | 1.2% |
| Standard Deviation (Sample) | 0.56% | 0.81% |
| Standard Deviation (Population) | 0.56% | 0.79% |
Similar Demographics by Single Father Households
Demographics Similar to Thais by Single Father Households
In terms of single father households, the demographic groups most similar to Thais are Iranian (1.9%, a difference of 0.070%), Immigrants from Albania (1.9%, a difference of 0.30%), Immigrants from Latvia (1.9%, a difference of 0.49%), Indian (Asian) (1.9%, a difference of 0.91%), and Immigrants from India (1.9%, a difference of 1.4%).
| Demographics | Rating | Rank | Single Father Households |
| Immigrants | Singapore | 100.0 /100 | #13 | Exceptional 1.9% |
| Immigrants | Lithuania | 100.0 /100 | #14 | Exceptional 1.9% |
| Immigrants | Eastern Asia | 100.0 /100 | #15 | Exceptional 1.9% |
| Immigrants | Iran | 100.0 /100 | #16 | Exceptional 1.9% |
| Immigrants | India | 100.0 /100 | #17 | Exceptional 1.9% |
| Indians (Asian) | 100.0 /100 | #18 | Exceptional 1.9% |
| Iranians | 100.0 /100 | #19 | Exceptional 1.9% |
| Thais | 100.0 /100 | #20 | Exceptional 1.9% |
| Immigrants | Albania | 100.0 /100 | #21 | Exceptional 1.9% |
| Immigrants | Latvia | 100.0 /100 | #22 | Exceptional 1.9% |
| Immigrants | Croatia | 100.0 /100 | #23 | Exceptional 2.0% |
| Immigrants | Russia | 100.0 /100 | #24 | Exceptional 2.0% |
| Eastern Europeans | 100.0 /100 | #25 | Exceptional 2.0% |
| Assyrians/Chaldeans/Syriacs | 100.0 /100 | #26 | Exceptional 2.0% |
| Immigrants | South Central Asia | 100.0 /100 | #27 | Exceptional 2.0% |
Demographics Similar to Immigrants from Zaire by Single Father Households
In terms of single father households, the demographic groups most similar to Immigrants from Zaire are Subsaharan African (2.4%, a difference of 0.090%), Immigrants from Ghana (2.4%, a difference of 0.11%), American (2.4%, a difference of 0.15%), Black/African American (2.4%, a difference of 0.21%), and Marshallese (2.4%, a difference of 0.23%).
| Demographics | Rating | Rank | Single Father Households |
| Immigrants | Eastern Africa | 11.9 /100 | #222 | Poor 2.4% |
| Immigrants | Uruguay | 11.0 /100 | #223 | Poor 2.4% |
| Immigrants | Bahamas | 10.6 /100 | #224 | Poor 2.4% |
| Marshallese | 9.7 /100 | #225 | Tragic 2.4% |
| Blacks/African Americans | 9.7 /100 | #226 | Tragic 2.4% |
| Americans | 9.3 /100 | #227 | Tragic 2.4% |
| Immigrants | Ghana | 9.1 /100 | #228 | Tragic 2.4% |
| Immigrants | Zaire | 8.6 /100 | #229 | Tragic 2.4% |
| Sub-Saharan Africans | 8.3 /100 | #230 | Tragic 2.4% |
| Immigrants | Nonimmigrants | 7.6 /100 | #231 | Tragic 2.4% |
| Pennsylvania Germans | 7.3 /100 | #232 | Tragic 2.4% |
| Immigrants | Western Africa | 7.0 /100 | #233 | Tragic 2.4% |
| Africans | 6.3 /100 | #234 | Tragic 2.5% |
| Immigrants | Immigrants | 6.3 /100 | #235 | Tragic 2.5% |
| Cajuns | 6.1 /100 | #236 | Tragic 2.5% |