Taiwanese vs Immigrants from Vietnam Single Mother Households
COMPARE
Taiwanese
Immigrants from Vietnam
Single Mother Households
Single Mother Households Comparison
Taiwanese
Immigrants from Vietnam
5.8%
SINGLE MOTHER HOUSEHOLDS
96.1/ 100
METRIC RATING
105th/ 347
METRIC RANK
6.3%
SINGLE MOTHER HOUSEHOLDS
51.5/ 100
METRIC RATING
173rd/ 347
METRIC RANK
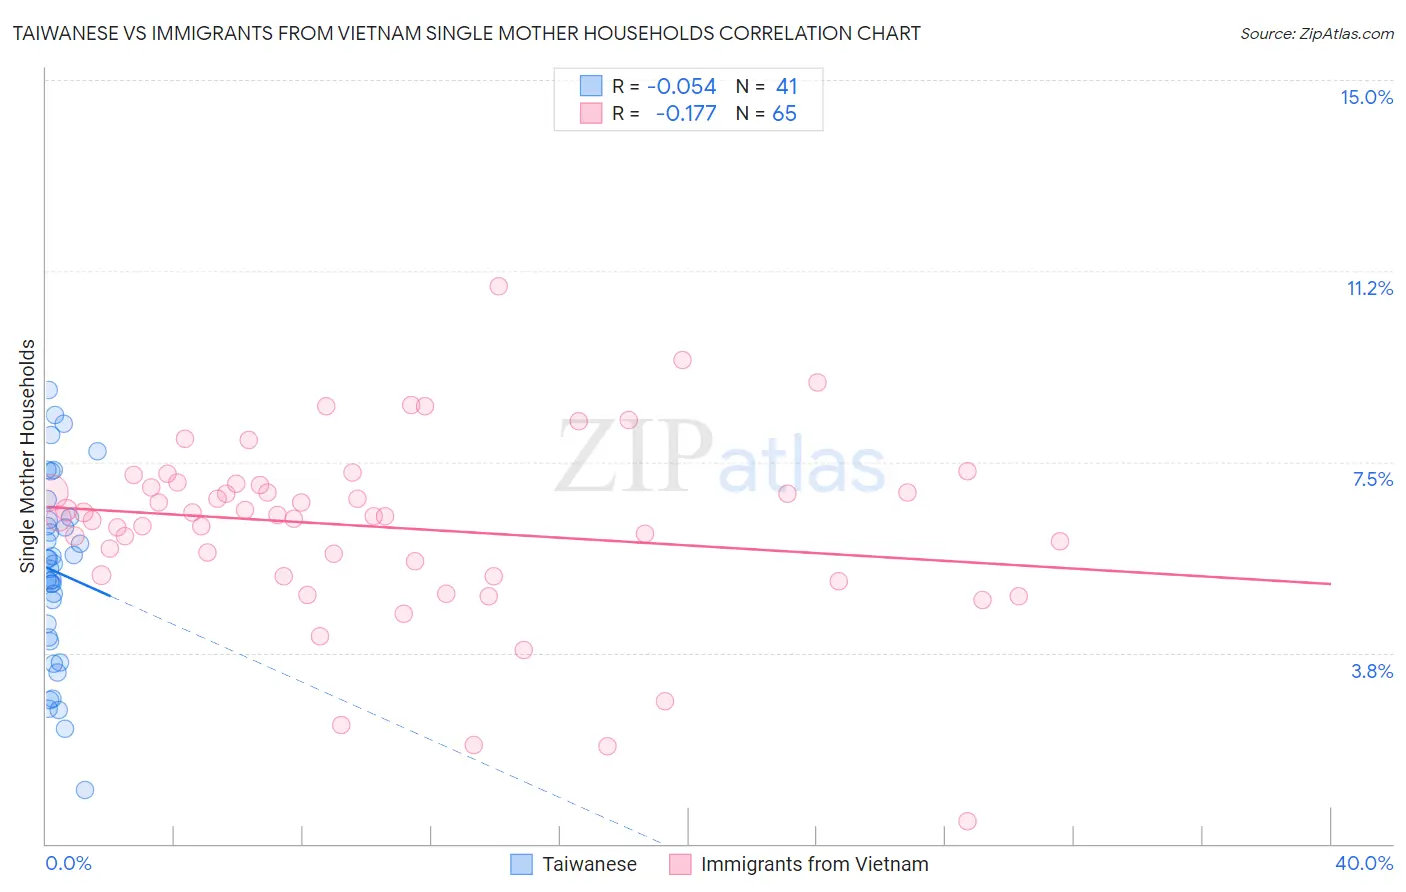
Taiwanese vs Immigrants from Vietnam Single Mother Households Correlation Chart
The statistical analysis conducted on geographies consisting of 31,687,013 people shows a slight negative correlation between the proportion of Taiwanese and percentage of single mother households in the United States with a correlation coefficient (R) of -0.054 and weighted average of 5.8%. Similarly, the statistical analysis conducted on geographies consisting of 403,855,615 people shows a poor negative correlation between the proportion of Immigrants from Vietnam and percentage of single mother households in the United States with a correlation coefficient (R) of -0.177 and weighted average of 6.3%, a difference of 9.4%.
Single Mother Households Correlation Summary
| Measurement | Taiwanese | Immigrants from Vietnam |
| Minimum | 1.1% | 0.45% |
| Maximum | 8.9% | 11.0% |
| Range | 7.8% | 10.5% |
| Mean | 5.3% | 6.2% |
| Median | 5.5% | 6.4% |
| Interquartile 25% (IQ1) | 4.0% | 5.3% |
| Interquartile 75% (IQ3) | 6.4% | 7.1% |
| Interquartile Range (IQR) | 2.4% | 1.8% |
| Standard Deviation (Sample) | 1.8% | 1.8% |
| Standard Deviation (Population) | 1.8% | 1.8% |
Similar Demographics by Single Mother Households
Demographics Similar to Taiwanese by Single Mother Households
In terms of single mother households, the demographic groups most similar to Taiwanese are Northern European (5.8%, a difference of 0.070%), Scottish (5.8%, a difference of 0.080%), German (5.8%, a difference of 0.10%), English (5.8%, a difference of 0.10%), and Immigrants from Ukraine (5.8%, a difference of 0.10%).
| Demographics | Rating | Rank | Single Mother Households |
| Immigrants | South Africa | 96.3 /100 | #98 | Exceptional 5.7% |
| Immigrants | Poland | 96.3 /100 | #99 | Exceptional 5.8% |
| Scandinavians | 96.2 /100 | #100 | Exceptional 5.8% |
| Germans | 96.2 /100 | #101 | Exceptional 5.8% |
| English | 96.2 /100 | #102 | Exceptional 5.8% |
| Scottish | 96.2 /100 | #103 | Exceptional 5.8% |
| Northern Europeans | 96.2 /100 | #104 | Exceptional 5.8% |
| Taiwanese | 96.1 /100 | #105 | Exceptional 5.8% |
| Immigrants | Ukraine | 95.9 /100 | #106 | Exceptional 5.8% |
| Paraguayans | 95.8 /100 | #107 | Exceptional 5.8% |
| Immigrants | Italy | 95.8 /100 | #108 | Exceptional 5.8% |
| Immigrants | Western Europe | 95.7 /100 | #109 | Exceptional 5.8% |
| British | 95.5 /100 | #110 | Exceptional 5.8% |
| Immigrants | England | 95.5 /100 | #111 | Exceptional 5.8% |
| Immigrants | Kuwait | 95.4 /100 | #112 | Exceptional 5.8% |
Demographics Similar to Immigrants from Vietnam by Single Mother Households
In terms of single mother households, the demographic groups most similar to Immigrants from Vietnam are Immigrants from South Eastern Asia (6.3%, a difference of 0.070%), Afghan (6.3%, a difference of 0.11%), Immigrants from Morocco (6.3%, a difference of 0.17%), Immigrants from Oceania (6.3%, a difference of 0.34%), and Marshallese (6.3%, a difference of 0.63%).
| Demographics | Rating | Rank | Single Mother Households |
| Sri Lankans | 63.9 /100 | #166 | Good 6.2% |
| Brazilians | 59.1 /100 | #167 | Average 6.2% |
| Immigrants | Chile | 58.3 /100 | #168 | Average 6.3% |
| Puget Sound Salish | 58.1 /100 | #169 | Average 6.3% |
| Immigrants | Oceania | 54.6 /100 | #170 | Average 6.3% |
| Afghans | 52.5 /100 | #171 | Average 6.3% |
| Immigrants | South Eastern Asia | 52.2 /100 | #172 | Average 6.3% |
| Immigrants | Vietnam | 51.5 /100 | #173 | Average 6.3% |
| Immigrants | Morocco | 50.0 /100 | #174 | Average 6.3% |
| Marshallese | 45.8 /100 | #175 | Average 6.3% |
| Immigrants | Bosnia and Herzegovina | 44.3 /100 | #176 | Average 6.3% |
| Osage | 43.0 /100 | #177 | Average 6.4% |
| Portuguese | 40.0 /100 | #178 | Fair 6.4% |
| Hmong | 39.8 /100 | #179 | Fair 6.4% |
| Immigrants | Nepal | 36.1 /100 | #180 | Fair 6.4% |