Syrian vs Immigrants from Ecuador Single Father Households
COMPARE
Syrian
Immigrants from Ecuador
Single Father Households
Single Father Households Comparison
Syrians
Immigrants from Ecuador
2.2%
SINGLE FATHER HOUSEHOLDS
94.8/ 100
METRIC RATING
135th/ 347
METRIC RANK
2.4%
SINGLE FATHER HOUSEHOLDS
14.9/ 100
METRIC RATING
216th/ 347
METRIC RANK
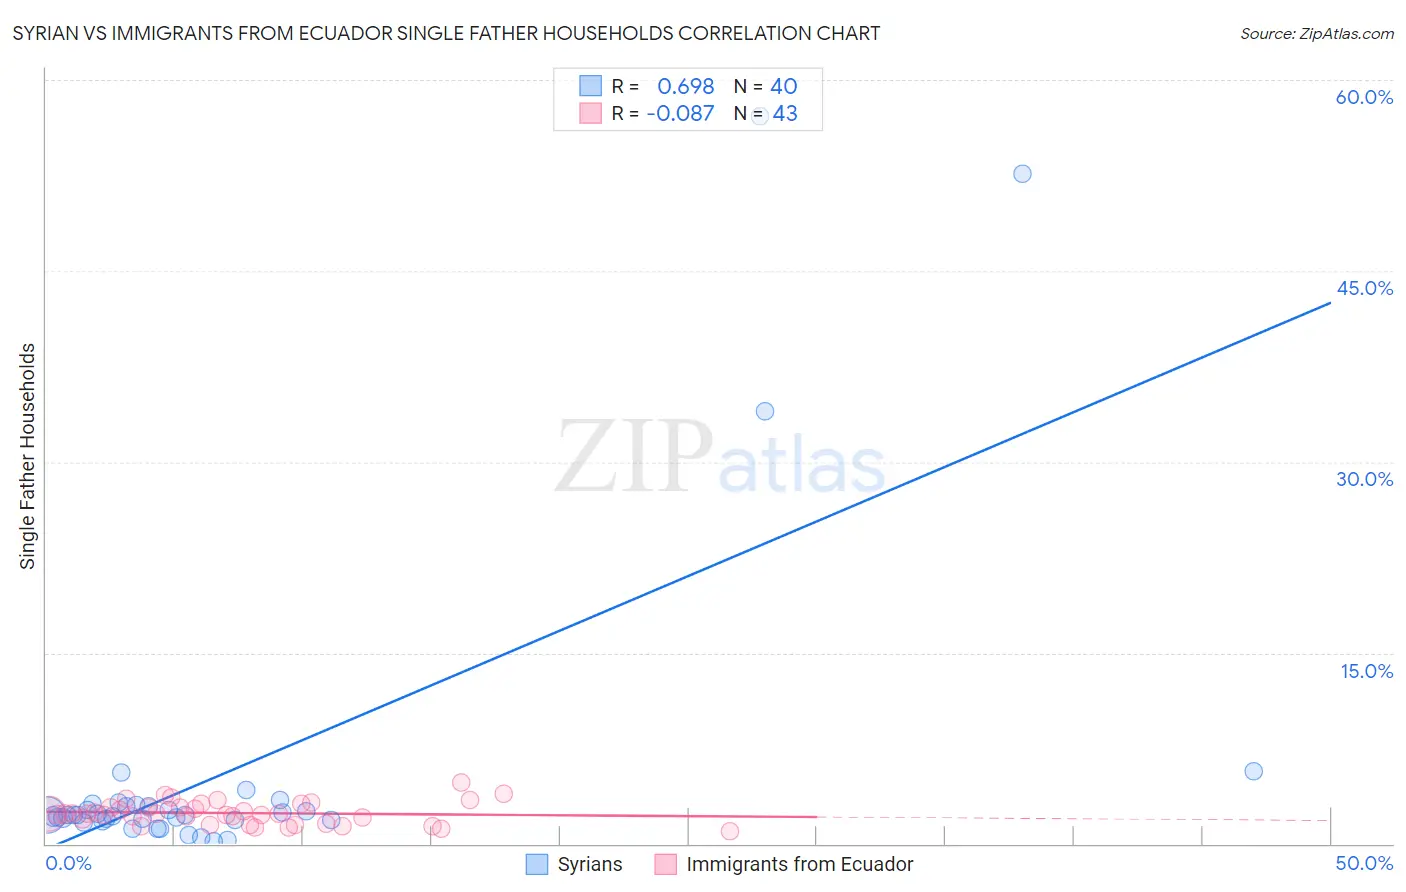
Syrian vs Immigrants from Ecuador Single Father Households Correlation Chart
The statistical analysis conducted on geographies consisting of 264,617,959 people shows a significant positive correlation between the proportion of Syrians and percentage of single father households in the United States with a correlation coefficient (R) of 0.698 and weighted average of 2.2%. Similarly, the statistical analysis conducted on geographies consisting of 269,379,294 people shows a slight negative correlation between the proportion of Immigrants from Ecuador and percentage of single father households in the United States with a correlation coefficient (R) of -0.087 and weighted average of 2.4%, a difference of 9.0%.
Single Father Households Correlation Summary
| Measurement | Syrian | Immigrants from Ecuador |
| Minimum | 0.16% | 0.94% |
| Maximum | 57.1% | 4.9% |
| Range | 57.0% | 3.9% |
| Mean | 5.7% | 2.4% |
| Median | 2.2% | 2.3% |
| Interquartile 25% (IQ1) | 1.9% | 1.5% |
| Interquartile 75% (IQ3) | 3.0% | 2.9% |
| Interquartile Range (IQR) | 1.1% | 1.4% |
| Standard Deviation (Sample) | 12.5% | 0.87% |
| Standard Deviation (Population) | 12.4% | 0.86% |
Similar Demographics by Single Father Households
Demographics Similar to Syrians by Single Father Households
In terms of single father households, the demographic groups most similar to Syrians are Zimbabwean (2.2%, a difference of 0.11%), Chilean (2.2%, a difference of 0.12%), Austrian (2.2%, a difference of 0.23%), West Indian (2.2%, a difference of 0.26%), and Brazilian (2.2%, a difference of 0.68%).
| Demographics | Rating | Rank | Single Father Households |
| Immigrants | England | 96.8 /100 | #128 | Exceptional 2.2% |
| Serbians | 96.8 /100 | #129 | Exceptional 2.2% |
| Immigrants | Chile | 96.7 /100 | #130 | Exceptional 2.2% |
| Immigrants | Jordan | 96.6 /100 | #131 | Exceptional 2.2% |
| Poles | 96.5 /100 | #132 | Exceptional 2.2% |
| Taiwanese | 96.3 /100 | #133 | Exceptional 2.2% |
| Zimbabweans | 95.1 /100 | #134 | Exceptional 2.2% |
| Syrians | 94.8 /100 | #135 | Exceptional 2.2% |
| Chileans | 94.5 /100 | #136 | Exceptional 2.2% |
| Austrians | 94.2 /100 | #137 | Exceptional 2.2% |
| West Indians | 94.1 /100 | #138 | Exceptional 2.2% |
| Brazilians | 92.8 /100 | #139 | Exceptional 2.2% |
| British | 92.8 /100 | #140 | Exceptional 2.2% |
| Laotians | 92.5 /100 | #141 | Exceptional 2.2% |
| Luxembourgers | 92.3 /100 | #142 | Exceptional 2.2% |
Demographics Similar to Immigrants from Ecuador by Single Father Households
In terms of single father households, the demographic groups most similar to Immigrants from Ecuador are Dutch (2.4%, a difference of 0.090%), Immigrants from South Eastern Asia (2.4%, a difference of 0.13%), Immigrants from Ethiopia (2.4%, a difference of 0.22%), Ethiopian (2.4%, a difference of 0.23%), and Norwegian (2.4%, a difference of 0.29%).
| Demographics | Rating | Rank | Single Father Households |
| Immigrants | Peru | 19.3 /100 | #209 | Poor 2.4% |
| Immigrants | Costa Rica | 19.2 /100 | #210 | Poor 2.4% |
| Immigrants | Nigeria | 18.7 /100 | #211 | Poor 2.4% |
| Finns | 18.3 /100 | #212 | Poor 2.4% |
| Norwegians | 17.1 /100 | #213 | Poor 2.4% |
| Ethiopians | 16.6 /100 | #214 | Poor 2.4% |
| Immigrants | South Eastern Asia | 15.9 /100 | #215 | Poor 2.4% |
| Immigrants | Ecuador | 14.9 /100 | #216 | Poor 2.4% |
| Dutch | 14.3 /100 | #217 | Poor 2.4% |
| Immigrants | Ethiopia | 13.4 /100 | #218 | Poor 2.4% |
| Sudanese | 13.0 /100 | #219 | Poor 2.4% |
| Ghanaians | 12.9 /100 | #220 | Poor 2.4% |
| Immigrants | Burma/Myanmar | 12.1 /100 | #221 | Poor 2.4% |
| Immigrants | Eastern Africa | 11.9 /100 | #222 | Poor 2.4% |
| Immigrants | Uruguay | 11.0 /100 | #223 | Poor 2.4% |