Immigrants from Lebanon vs Immigrants from Ecuador Average Family Size
COMPARE
Immigrants from Lebanon
Immigrants from Ecuador
Average Family Size
Average Family Size Comparison
Immigrants from Lebanon
Immigrants from Ecuador
3.30
AVERAGE FAMILY SIZE
99.0/ 100
METRIC RATING
95th/ 347
METRIC RANK
3.32
AVERAGE FAMILY SIZE
99.8/ 100
METRIC RATING
77th/ 347
METRIC RANK
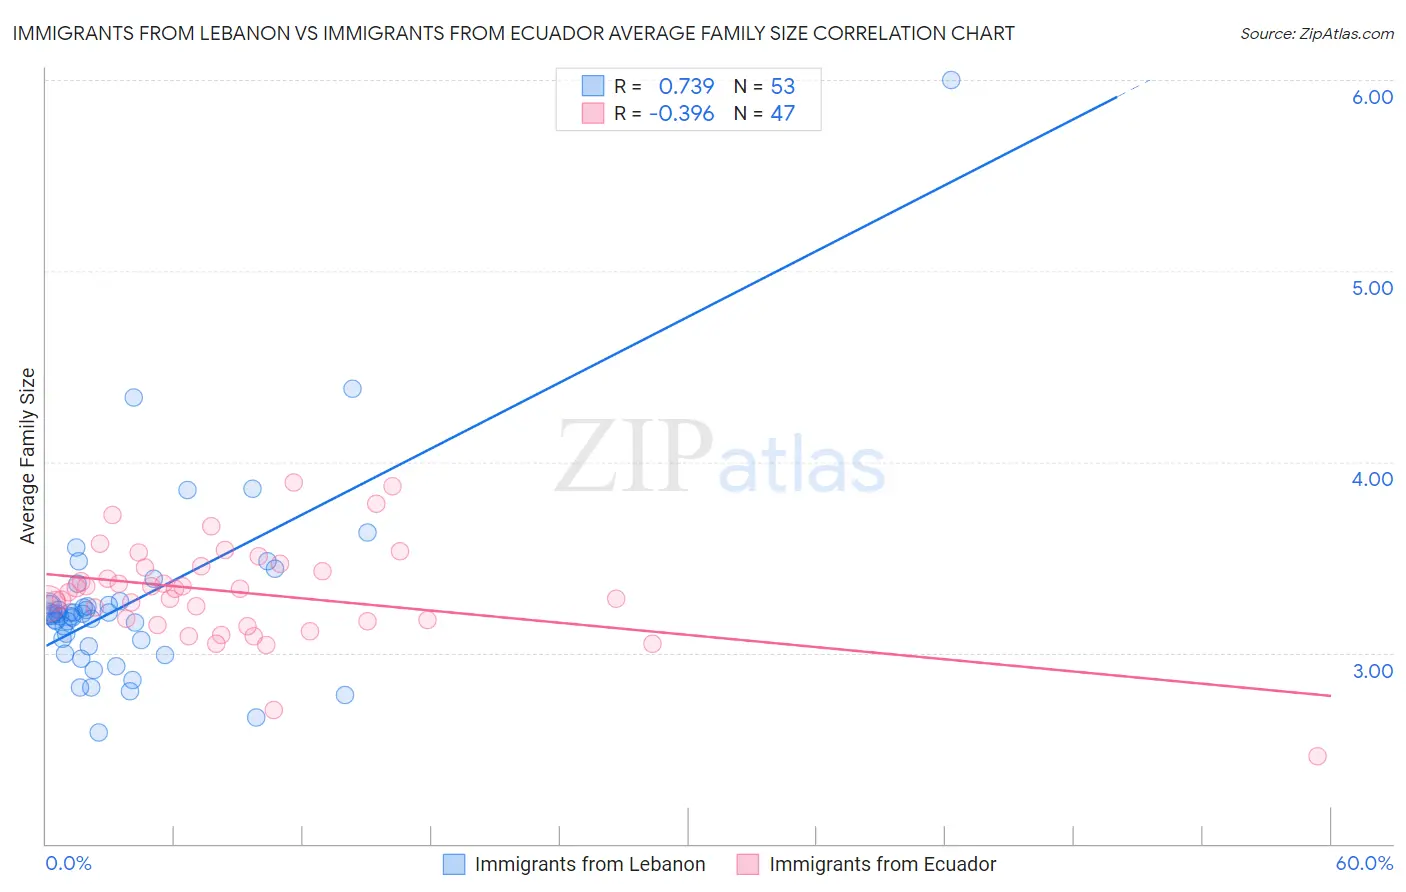
Immigrants from Lebanon vs Immigrants from Ecuador Average Family Size Correlation Chart
The statistical analysis conducted on geographies consisting of 217,130,535 people shows a strong positive correlation between the proportion of Immigrants from Lebanon and average family size in the United States with a correlation coefficient (R) of 0.739 and weighted average of 3.30. Similarly, the statistical analysis conducted on geographies consisting of 270,888,675 people shows a mild negative correlation between the proportion of Immigrants from Ecuador and average family size in the United States with a correlation coefficient (R) of -0.396 and weighted average of 3.32, a difference of 0.81%.
Average Family Size Correlation Summary
| Measurement | Immigrants from Lebanon | Immigrants from Ecuador |
| Minimum | 2.58 | 2.46 |
| Maximum | 6.00 | 3.89 |
| Range | 3.42 | 1.43 |
| Mean | 3.27 | 3.32 |
| Median | 3.20 | 3.34 |
| Interquartile 25% (IQ1) | 3.05 | 3.17 |
| Interquartile 75% (IQ3) | 3.26 | 3.46 |
| Interquartile Range (IQR) | 0.21 | 0.29 |
| Standard Deviation (Sample) | 0.51 | 0.26 |
| Standard Deviation (Population) | 0.51 | 0.26 |
Demographics Similar to Immigrants from Lebanon and Immigrants from Ecuador by Average Family Size
In terms of average family size, the demographic groups most similar to Immigrants from Lebanon are Sierra Leonean (3.30, a difference of 0.010%), U.S. Virgin Islander (3.29, a difference of 0.080%), Peruvian (3.30, a difference of 0.11%), Immigrants from Cameroon (3.30, a difference of 0.12%), and Immigrants from Pakistan (3.30, a difference of 0.13%). Similarly, the demographic groups most similar to Immigrants from Ecuador are Trinidadian and Tobagonian (3.32, a difference of 0.010%), Immigrants from Micronesia (3.32, a difference of 0.040%), British West Indian (3.32, a difference of 0.050%), Lumbee (3.32, a difference of 0.070%), and Immigrants from Dominica (3.32, a difference of 0.11%).
| Demographics | Rating | Rank | Average Family Size |
| Trinidadians and Tobagonians | 99.8 /100 | #76 | Exceptional 3.32 |
| Immigrants | Ecuador | 99.8 /100 | #77 | Exceptional 3.32 |
| Immigrants | Micronesia | 99.8 /100 | #78 | Exceptional 3.32 |
| British West Indians | 99.8 /100 | #79 | Exceptional 3.32 |
| Lumbee | 99.8 /100 | #80 | Exceptional 3.32 |
| Immigrants | Dominica | 99.8 /100 | #81 | Exceptional 3.32 |
| Ecuadorians | 99.8 /100 | #82 | Exceptional 3.32 |
| Immigrants | Afghanistan | 99.8 /100 | #83 | Exceptional 3.32 |
| Immigrants | Nigeria | 99.7 /100 | #84 | Exceptional 3.32 |
| Afghans | 99.7 /100 | #85 | Exceptional 3.31 |
| Jamaicans | 99.7 /100 | #86 | Exceptional 3.31 |
| Immigrants | Peru | 99.7 /100 | #87 | Exceptional 3.31 |
| Immigrants | Bolivia | 99.6 /100 | #88 | Exceptional 3.31 |
| Malaysians | 99.6 /100 | #89 | Exceptional 3.31 |
| Menominee | 99.4 /100 | #90 | Exceptional 3.30 |
| Immigrants | Pakistan | 99.2 /100 | #91 | Exceptional 3.30 |
| Immigrants | Cameroon | 99.2 /100 | #92 | Exceptional 3.30 |
| Peruvians | 99.2 /100 | #93 | Exceptional 3.30 |
| Sierra Leoneans | 99.0 /100 | #94 | Exceptional 3.30 |
| Immigrants | Lebanon | 99.0 /100 | #95 | Exceptional 3.30 |
| U.S. Virgin Islanders | 98.8 /100 | #96 | Exceptional 3.29 |