German vs Immigrants from Ecuador Average Family Size
COMPARE
German
Immigrants from Ecuador
Average Family Size
Average Family Size Comparison
Germans
Immigrants from Ecuador
3.09
AVERAGE FAMILY SIZE
0.0/ 100
METRIC RATING
342nd/ 347
METRIC RANK
3.32
AVERAGE FAMILY SIZE
99.8/ 100
METRIC RATING
77th/ 347
METRIC RANK
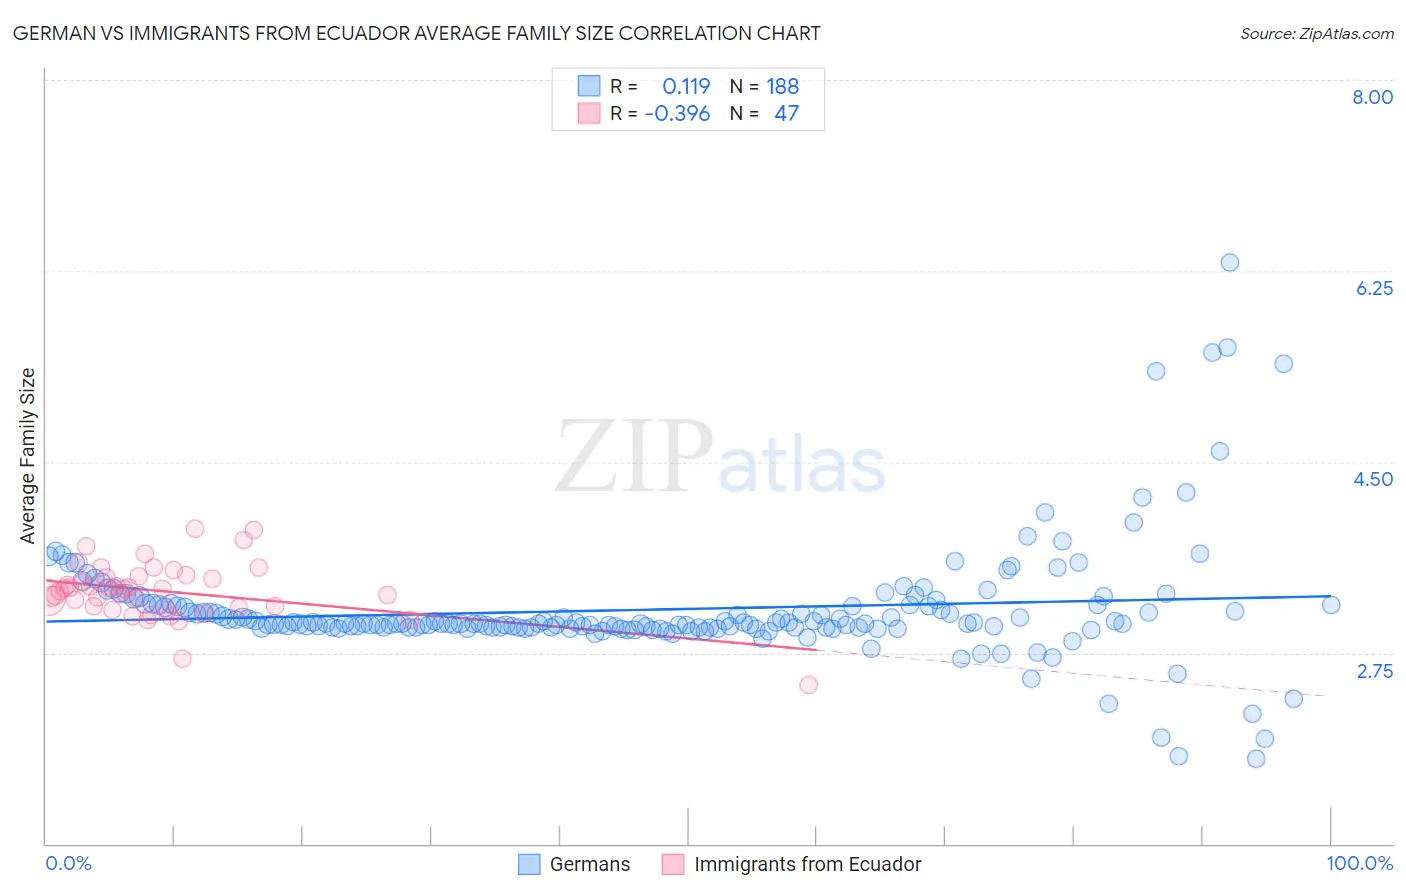
German vs Immigrants from Ecuador Average Family Size Correlation Chart
The statistical analysis conducted on geographies consisting of 580,609,080 people shows a poor positive correlation between the proportion of Germans and average family size in the United States with a correlation coefficient (R) of 0.119 and weighted average of 3.09. Similarly, the statistical analysis conducted on geographies consisting of 270,888,675 people shows a mild negative correlation between the proportion of Immigrants from Ecuador and average family size in the United States with a correlation coefficient (R) of -0.396 and weighted average of 3.32, a difference of 7.5%.
Average Family Size Correlation Summary
| Measurement | German | Immigrants from Ecuador |
| Minimum | 1.78 | 2.46 |
| Maximum | 6.33 | 3.89 |
| Range | 4.55 | 1.43 |
| Mean | 3.15 | 3.32 |
| Median | 3.02 | 3.34 |
| Interquartile 25% (IQ1) | 2.98 | 3.17 |
| Interquartile 75% (IQ3) | 3.18 | 3.46 |
| Interquartile Range (IQR) | 0.20 | 0.29 |
| Standard Deviation (Sample) | 0.54 | 0.26 |
| Standard Deviation (Population) | 0.54 | 0.26 |
Similar Demographics by Average Family Size
Demographics Similar to Germans by Average Family Size
In terms of average family size, the demographic groups most similar to Germans are Polish (3.09, a difference of 0.14%), Finnish (3.09, a difference of 0.19%), Norwegian (3.08, a difference of 0.23%), Croatian (3.10, a difference of 0.33%), and French (3.10, a difference of 0.34%).
| Demographics | Rating | Rank | Average Family Size |
| Estonians | 0.0 /100 | #333 | Tragic 3.10 |
| Lithuanians | 0.0 /100 | #334 | Tragic 3.10 |
| Luxembourgers | 0.0 /100 | #335 | Tragic 3.10 |
| Irish | 0.0 /100 | #336 | Tragic 3.10 |
| Swedes | 0.0 /100 | #337 | Tragic 3.10 |
| French | 0.0 /100 | #338 | Tragic 3.10 |
| Croatians | 0.0 /100 | #339 | Tragic 3.10 |
| Finns | 0.0 /100 | #340 | Tragic 3.09 |
| Poles | 0.0 /100 | #341 | Tragic 3.09 |
| Germans | 0.0 /100 | #342 | Tragic 3.09 |
| Norwegians | 0.0 /100 | #343 | Tragic 3.08 |
| French Canadians | 0.0 /100 | #344 | Tragic 3.07 |
| Slovenes | 0.0 /100 | #345 | Tragic 3.07 |
| Slovaks | 0.0 /100 | #346 | Tragic 3.06 |
| Carpatho Rusyns | 0.0 /100 | #347 | Tragic 3.06 |
Demographics Similar to Immigrants from Ecuador by Average Family Size
In terms of average family size, the demographic groups most similar to Immigrants from Ecuador are Trinidadian and Tobagonian (3.32, a difference of 0.010%), Immigrants from Barbados (3.32, a difference of 0.030%), Immigrants from Micronesia (3.32, a difference of 0.040%), British West Indian (3.32, a difference of 0.050%), and Immigrants from Sierra Leone (3.32, a difference of 0.060%).
| Demographics | Rating | Rank | Average Family Size |
| Immigrants | Trinidad and Tobago | 99.9 /100 | #70 | Exceptional 3.33 |
| Immigrants | West Indies | 99.9 /100 | #71 | Exceptional 3.33 |
| Immigrants | Caribbean | 99.9 /100 | #72 | Exceptional 3.33 |
| Yaqui | 99.9 /100 | #73 | Exceptional 3.32 |
| Immigrants | Sierra Leone | 99.9 /100 | #74 | Exceptional 3.32 |
| Immigrants | Barbados | 99.8 /100 | #75 | Exceptional 3.32 |
| Trinidadians and Tobagonians | 99.8 /100 | #76 | Exceptional 3.32 |
| Immigrants | Ecuador | 99.8 /100 | #77 | Exceptional 3.32 |
| Immigrants | Micronesia | 99.8 /100 | #78 | Exceptional 3.32 |
| British West Indians | 99.8 /100 | #79 | Exceptional 3.32 |
| Lumbee | 99.8 /100 | #80 | Exceptional 3.32 |
| Immigrants | Dominica | 99.8 /100 | #81 | Exceptional 3.32 |
| Ecuadorians | 99.8 /100 | #82 | Exceptional 3.32 |
| Immigrants | Afghanistan | 99.8 /100 | #83 | Exceptional 3.32 |
| Immigrants | Nigeria | 99.7 /100 | #84 | Exceptional 3.32 |