Paiute vs Immigrants from Croatia Single Father Households
COMPARE
Paiute
Immigrants from Croatia
Single Father Households
Single Father Households Comparison
Paiute
Immigrants from Croatia
3.3%
SINGLE FATHER HOUSEHOLDS
0.0/ 100
METRIC RATING
336th/ 347
METRIC RANK
2.0%
SINGLE FATHER HOUSEHOLDS
100.0/ 100
METRIC RATING
23rd/ 347
METRIC RANK
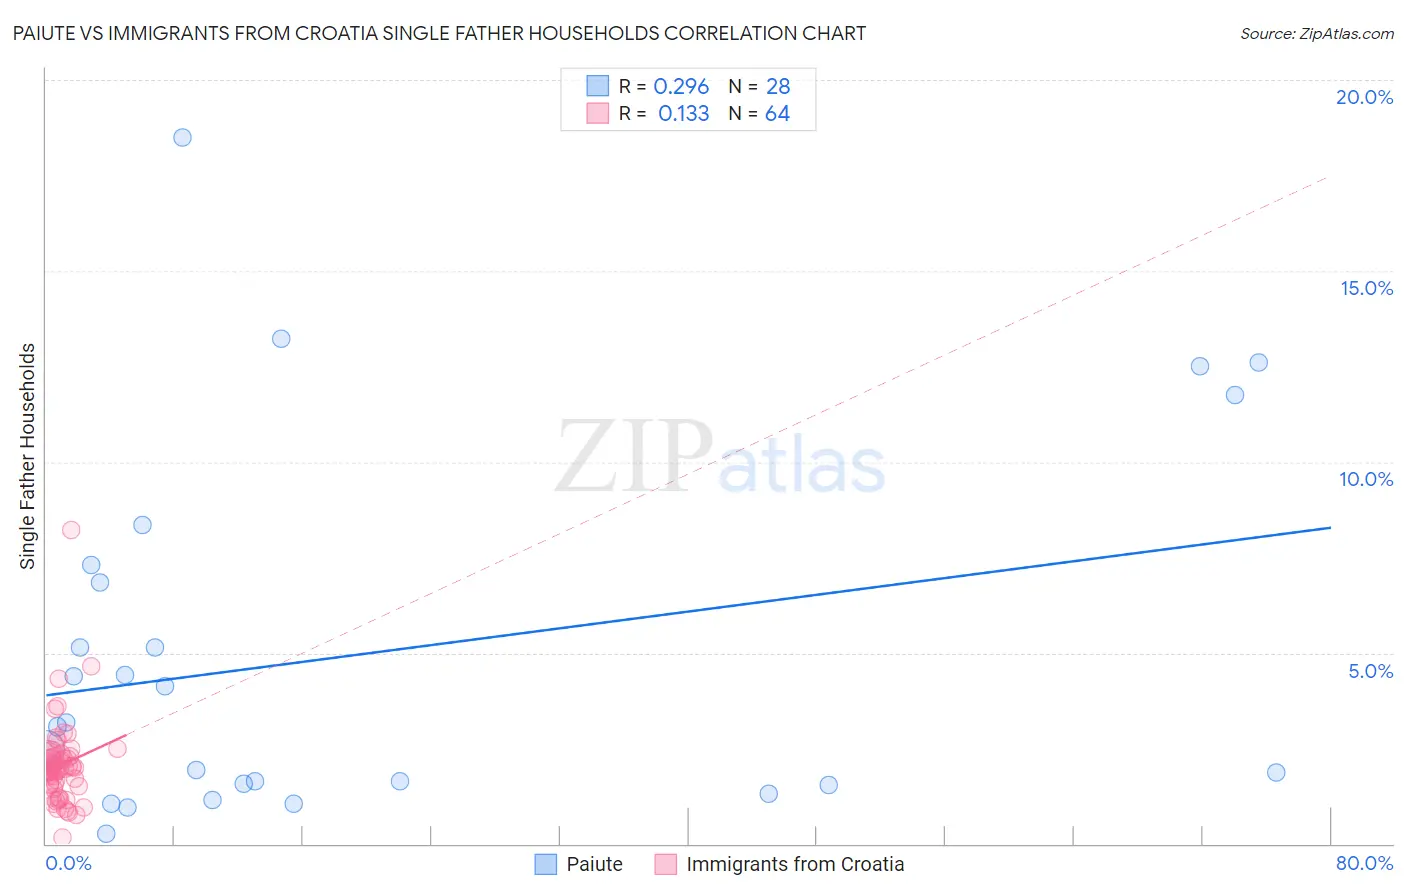
Paiute vs Immigrants from Croatia Single Father Households Correlation Chart
The statistical analysis conducted on geographies consisting of 58,300,881 people shows a weak positive correlation between the proportion of Paiute and percentage of single father households in the United States with a correlation coefficient (R) of 0.296 and weighted average of 3.3%. Similarly, the statistical analysis conducted on geographies consisting of 132,226,355 people shows a poor positive correlation between the proportion of Immigrants from Croatia and percentage of single father households in the United States with a correlation coefficient (R) of 0.133 and weighted average of 2.0%, a difference of 68.5%.
Single Father Households Correlation Summary
| Measurement | Paiute | Immigrants from Croatia |
| Minimum | 0.27% | 0.16% |
| Maximum | 18.5% | 8.2% |
| Range | 18.2% | 8.1% |
| Mean | 5.0% | 2.0% |
| Median | 3.1% | 2.0% |
| Interquartile 25% (IQ1) | 1.6% | 1.5% |
| Interquartile 75% (IQ3) | 7.1% | 2.3% |
| Interquartile Range (IQR) | 5.5% | 0.73% |
| Standard Deviation (Sample) | 4.7% | 1.1% |
| Standard Deviation (Population) | 4.7% | 1.1% |
Similar Demographics by Single Father Households
Demographics Similar to Paiute by Single Father Households
In terms of single father households, the demographic groups most similar to Paiute are Colville (3.3%, a difference of 0.030%), Yuman (3.3%, a difference of 0.050%), Pueblo (3.3%, a difference of 0.26%), Sioux (3.3%, a difference of 0.94%), and Alaskan Athabascan (3.4%, a difference of 2.4%).
| Demographics | Rating | Rank | Single Father Households |
| Chippewa | 0.0 /100 | #329 | Tragic 3.1% |
| Nepalese | 0.0 /100 | #330 | Tragic 3.1% |
| Navajo | 0.0 /100 | #331 | Tragic 3.2% |
| Yaqui | 0.0 /100 | #332 | Tragic 3.2% |
| Natives/Alaskans | 0.0 /100 | #333 | Tragic 3.2% |
| Yuman | 0.0 /100 | #334 | Tragic 3.3% |
| Colville | 0.0 /100 | #335 | Tragic 3.3% |
| Paiute | 0.0 /100 | #336 | Tragic 3.3% |
| Pueblo | 0.0 /100 | #337 | Tragic 3.3% |
| Sioux | 0.0 /100 | #338 | Tragic 3.3% |
| Alaskan Athabascans | 0.0 /100 | #339 | Tragic 3.4% |
| Alaska Natives | 0.0 /100 | #340 | Tragic 3.5% |
| Crow | 0.0 /100 | #341 | Tragic 3.5% |
| Tohono O'odham | 0.0 /100 | #342 | Tragic 3.8% |
| Pima | 0.0 /100 | #343 | Tragic 4.2% |
Demographics Similar to Immigrants from Croatia by Single Father Households
In terms of single father households, the demographic groups most similar to Immigrants from Croatia are Immigrants from Russia (2.0%, a difference of 0.0%), Eastern European (2.0%, a difference of 0.010%), Assyrian/Chaldean/Syriac (2.0%, a difference of 0.15%), Immigrants from South Central Asia (2.0%, a difference of 0.43%), and Immigrants from Japan (2.0%, a difference of 0.61%).
| Demographics | Rating | Rank | Single Father Households |
| Immigrants | Iran | 100.0 /100 | #16 | Exceptional 1.9% |
| Immigrants | India | 100.0 /100 | #17 | Exceptional 1.9% |
| Indians (Asian) | 100.0 /100 | #18 | Exceptional 1.9% |
| Iranians | 100.0 /100 | #19 | Exceptional 1.9% |
| Thais | 100.0 /100 | #20 | Exceptional 1.9% |
| Immigrants | Albania | 100.0 /100 | #21 | Exceptional 1.9% |
| Immigrants | Latvia | 100.0 /100 | #22 | Exceptional 1.9% |
| Immigrants | Croatia | 100.0 /100 | #23 | Exceptional 2.0% |
| Immigrants | Russia | 100.0 /100 | #24 | Exceptional 2.0% |
| Eastern Europeans | 100.0 /100 | #25 | Exceptional 2.0% |
| Assyrians/Chaldeans/Syriacs | 100.0 /100 | #26 | Exceptional 2.0% |
| Immigrants | South Central Asia | 100.0 /100 | #27 | Exceptional 2.0% |
| Immigrants | Japan | 100.0 /100 | #28 | Exceptional 2.0% |
| Bulgarians | 100.0 /100 | #29 | Exceptional 2.0% |
| Cambodians | 100.0 /100 | #30 | Exceptional 2.0% |