Immigrants from Canada vs Immigrants from Croatia Single Father Households
COMPARE
Immigrants from Canada
Immigrants from Croatia
Single Father Households
Single Father Households Comparison
Immigrants from Canada
Immigrants from Croatia
2.2%
SINGLE FATHER HOUSEHOLDS
98.3/ 100
METRIC RATING
111th/ 347
METRIC RANK
2.0%
SINGLE FATHER HOUSEHOLDS
100.0/ 100
METRIC RATING
23rd/ 347
METRIC RANK
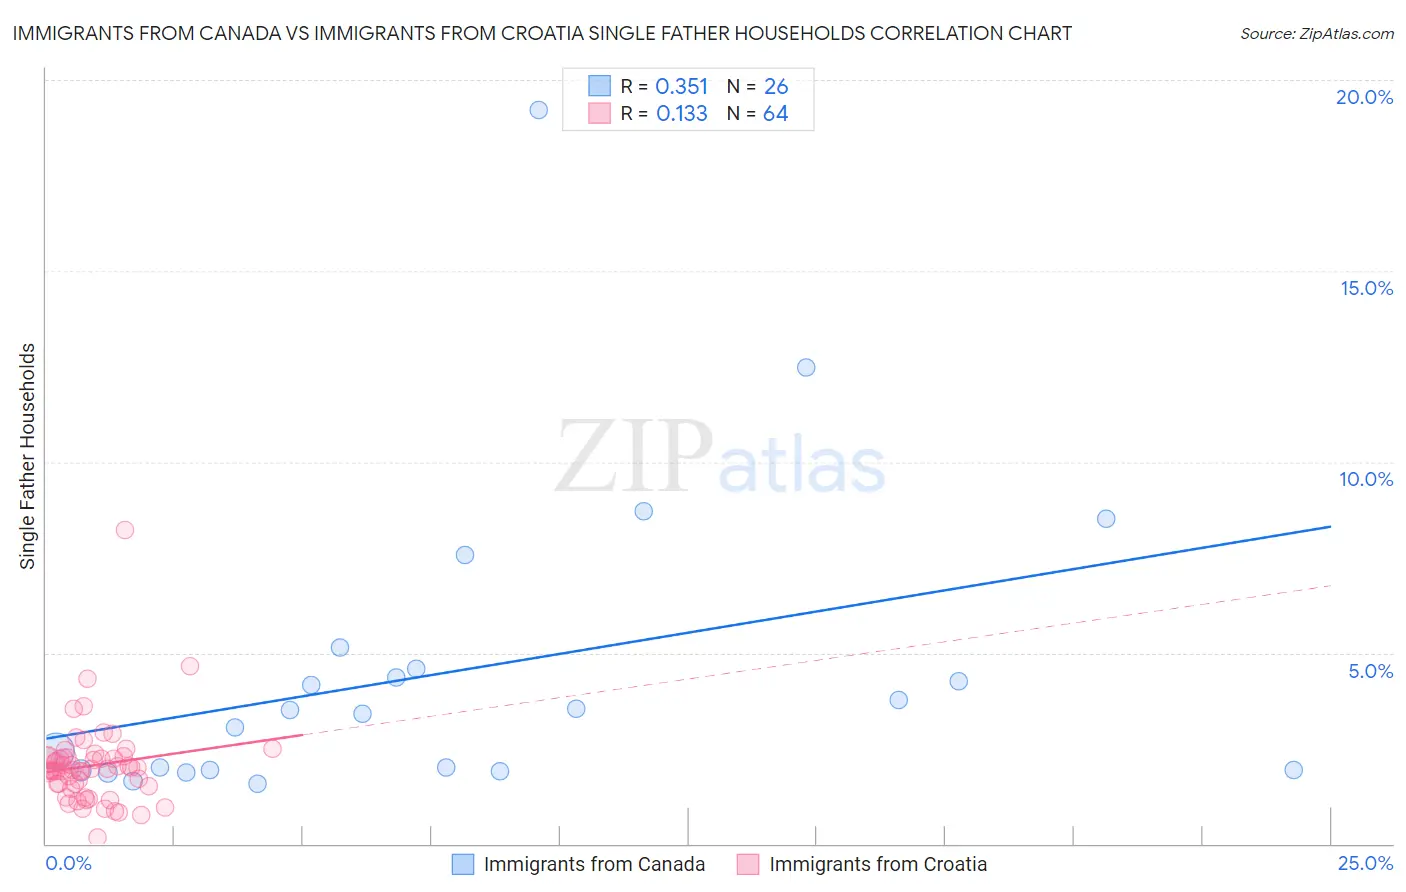
Immigrants from Canada vs Immigrants from Croatia Single Father Households Correlation Chart
The statistical analysis conducted on geographies consisting of 453,429,143 people shows a mild positive correlation between the proportion of Immigrants from Canada and percentage of single father households in the United States with a correlation coefficient (R) of 0.351 and weighted average of 2.2%. Similarly, the statistical analysis conducted on geographies consisting of 132,226,355 people shows a poor positive correlation between the proportion of Immigrants from Croatia and percentage of single father households in the United States with a correlation coefficient (R) of 0.133 and weighted average of 2.0%, a difference of 10.6%.
Single Father Households Correlation Summary
| Measurement | Immigrants from Canada | Immigrants from Croatia |
| Minimum | 1.6% | 0.16% |
| Maximum | 19.2% | 8.2% |
| Range | 17.6% | 8.1% |
| Mean | 4.5% | 2.0% |
| Median | 3.4% | 2.0% |
| Interquartile 25% (IQ1) | 1.9% | 1.5% |
| Interquartile 75% (IQ3) | 4.6% | 2.3% |
| Interquartile Range (IQR) | 2.6% | 0.73% |
| Standard Deviation (Sample) | 4.0% | 1.1% |
| Standard Deviation (Population) | 3.9% | 1.1% |
Similar Demographics by Single Father Households
Demographics Similar to Immigrants from Canada by Single Father Households
In terms of single father households, the demographic groups most similar to Immigrants from Canada are Immigrants from Trinidad and Tobago (2.2%, a difference of 0.040%), Iraqi (2.2%, a difference of 0.050%), Italian (2.2%, a difference of 0.080%), Immigrants from North America (2.2%, a difference of 0.090%), and Immigrants from Barbados (2.2%, a difference of 0.12%).
| Demographics | Rating | Rank | Single Father Households |
| Alsatians | 98.9 /100 | #104 | Exceptional 2.1% |
| Palestinians | 98.6 /100 | #105 | Exceptional 2.2% |
| Immigrants | Southern Europe | 98.6 /100 | #106 | Exceptional 2.2% |
| Slovenes | 98.5 /100 | #107 | Exceptional 2.2% |
| Immigrants | Netherlands | 98.5 /100 | #108 | Exceptional 2.2% |
| Barbadians | 98.4 /100 | #109 | Exceptional 2.2% |
| Italians | 98.3 /100 | #110 | Exceptional 2.2% |
| Immigrants | Canada | 98.3 /100 | #111 | Exceptional 2.2% |
| Immigrants | Trinidad and Tobago | 98.2 /100 | #112 | Exceptional 2.2% |
| Iraqis | 98.2 /100 | #113 | Exceptional 2.2% |
| Immigrants | North America | 98.2 /100 | #114 | Exceptional 2.2% |
| Immigrants | Barbados | 98.2 /100 | #115 | Exceptional 2.2% |
| Immigrants | Argentina | 98.1 /100 | #116 | Exceptional 2.2% |
| Hungarians | 97.9 /100 | #117 | Exceptional 2.2% |
| Immigrants | Morocco | 97.8 /100 | #118 | Exceptional 2.2% |
Demographics Similar to Immigrants from Croatia by Single Father Households
In terms of single father households, the demographic groups most similar to Immigrants from Croatia are Immigrants from Russia (2.0%, a difference of 0.0%), Eastern European (2.0%, a difference of 0.010%), Assyrian/Chaldean/Syriac (2.0%, a difference of 0.15%), Immigrants from South Central Asia (2.0%, a difference of 0.43%), and Immigrants from Japan (2.0%, a difference of 0.61%).
| Demographics | Rating | Rank | Single Father Households |
| Immigrants | Iran | 100.0 /100 | #16 | Exceptional 1.9% |
| Immigrants | India | 100.0 /100 | #17 | Exceptional 1.9% |
| Indians (Asian) | 100.0 /100 | #18 | Exceptional 1.9% |
| Iranians | 100.0 /100 | #19 | Exceptional 1.9% |
| Thais | 100.0 /100 | #20 | Exceptional 1.9% |
| Immigrants | Albania | 100.0 /100 | #21 | Exceptional 1.9% |
| Immigrants | Latvia | 100.0 /100 | #22 | Exceptional 1.9% |
| Immigrants | Croatia | 100.0 /100 | #23 | Exceptional 2.0% |
| Immigrants | Russia | 100.0 /100 | #24 | Exceptional 2.0% |
| Eastern Europeans | 100.0 /100 | #25 | Exceptional 2.0% |
| Assyrians/Chaldeans/Syriacs | 100.0 /100 | #26 | Exceptional 2.0% |
| Immigrants | South Central Asia | 100.0 /100 | #27 | Exceptional 2.0% |
| Immigrants | Japan | 100.0 /100 | #28 | Exceptional 2.0% |
| Bulgarians | 100.0 /100 | #29 | Exceptional 2.0% |
| Cambodians | 100.0 /100 | #30 | Exceptional 2.0% |