Swiss vs Polish Average Family Size
COMPARE
Swiss
Polish
Average Family Size
Average Family Size Comparison
Swiss
Poles
3.15
AVERAGE FAMILY SIZE
0.5/ 100
METRIC RATING
277th/ 347
METRIC RANK
3.09
AVERAGE FAMILY SIZE
0.0/ 100
METRIC RATING
341st/ 347
METRIC RANK
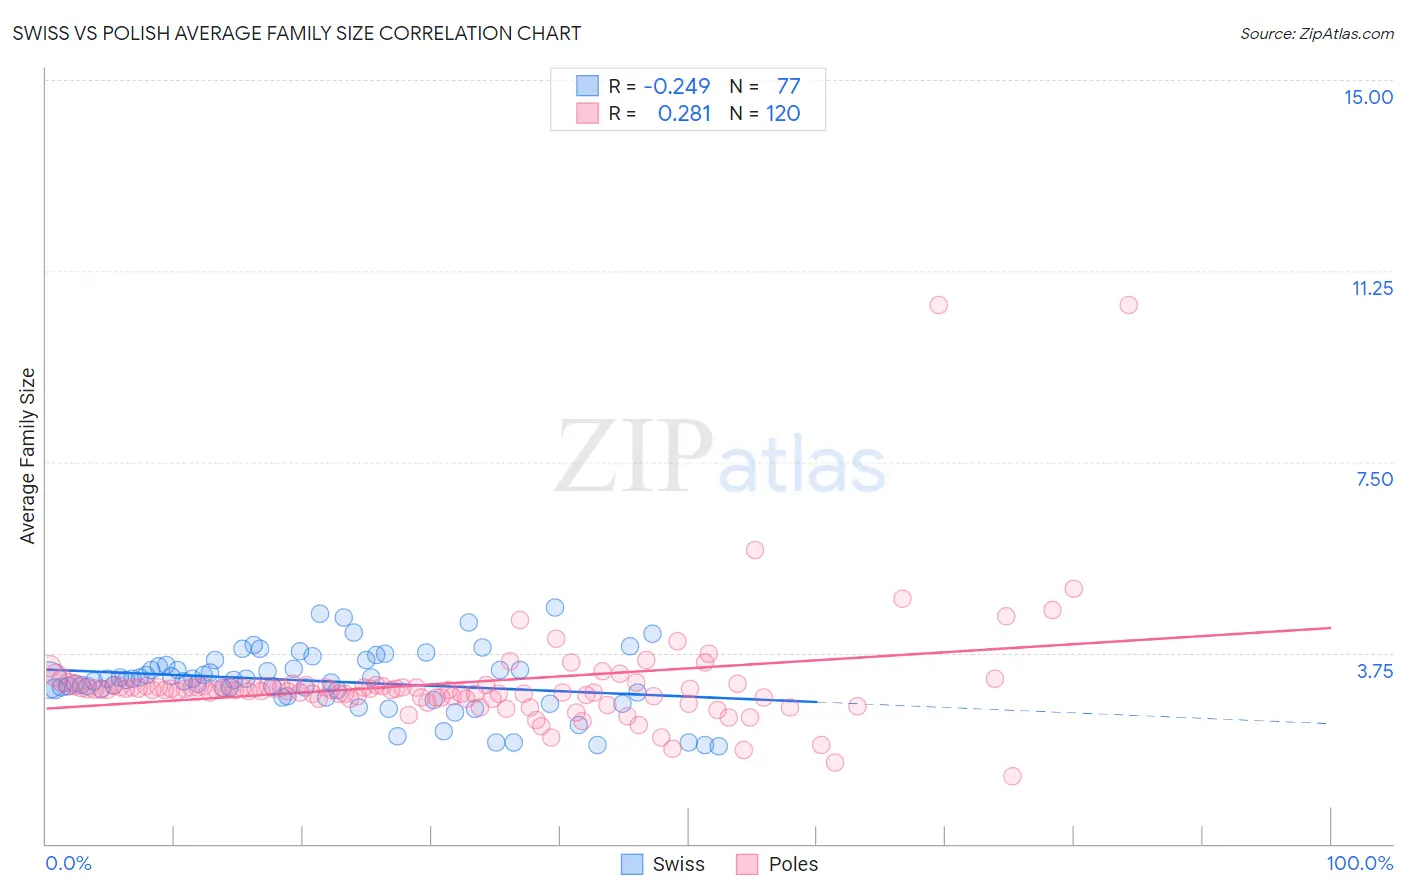
Swiss vs Polish Average Family Size Correlation Chart
The statistical analysis conducted on geographies consisting of 464,761,483 people shows a weak negative correlation between the proportion of Swiss and average family size in the United States with a correlation coefficient (R) of -0.249 and weighted average of 3.15. Similarly, the statistical analysis conducted on geographies consisting of 559,976,913 people shows a weak positive correlation between the proportion of Poles and average family size in the United States with a correlation coefficient (R) of 0.281 and weighted average of 3.09, a difference of 1.9%.
Average Family Size Correlation Summary
| Measurement | Swiss | Polish |
| Minimum | 1.91 | 1.32 |
| Maximum | 4.63 | 10.58 |
| Range | 2.72 | 9.26 |
| Mean | 3.20 | 3.15 |
| Median | 3.21 | 3.03 |
| Interquartile 25% (IQ1) | 2.94 | 2.87 |
| Interquartile 75% (IQ3) | 3.50 | 3.10 |
| Interquartile Range (IQR) | 0.56 | 0.23 |
| Standard Deviation (Sample) | 0.60 | 1.13 |
| Standard Deviation (Population) | 0.60 | 1.13 |
Similar Demographics by Average Family Size
Demographics Similar to Swiss by Average Family Size
In terms of average family size, the demographic groups most similar to Swiss are Immigrants from Bosnia and Herzegovina (3.15, a difference of 0.010%), Okinawan (3.15, a difference of 0.030%), Immigrants from Europe (3.15, a difference of 0.040%), Immigrants from England (3.15, a difference of 0.070%), and New Zealander (3.15, a difference of 0.10%).
| Demographics | Rating | Rank | Average Family Size |
| Tlingit-Haida | 0.7 /100 | #270 | Tragic 3.16 |
| Immigrants | Germany | 0.7 /100 | #271 | Tragic 3.15 |
| Immigrants | Lithuania | 0.6 /100 | #272 | Tragic 3.15 |
| New Zealanders | 0.6 /100 | #273 | Tragic 3.15 |
| Immigrants | Belgium | 0.6 /100 | #274 | Tragic 3.15 |
| Cambodians | 0.6 /100 | #275 | Tragic 3.15 |
| Immigrants | Bosnia and Herzegovina | 0.5 /100 | #276 | Tragic 3.15 |
| Swiss | 0.5 /100 | #277 | Tragic 3.15 |
| Okinawans | 0.5 /100 | #278 | Tragic 3.15 |
| Immigrants | Europe | 0.5 /100 | #279 | Tragic 3.15 |
| Immigrants | England | 0.4 /100 | #280 | Tragic 3.15 |
| Immigrants | Denmark | 0.4 /100 | #281 | Tragic 3.15 |
| Yugoslavians | 0.4 /100 | #282 | Tragic 3.15 |
| German Russians | 0.4 /100 | #283 | Tragic 3.15 |
| Immigrants | France | 0.4 /100 | #284 | Tragic 3.15 |
Demographics Similar to Poles by Average Family Size
In terms of average family size, the demographic groups most similar to Poles are Finnish (3.09, a difference of 0.050%), German (3.09, a difference of 0.14%), Croatian (3.10, a difference of 0.19%), French (3.10, a difference of 0.21%), and Swedish (3.10, a difference of 0.23%).
| Demographics | Rating | Rank | Average Family Size |
| Estonians | 0.0 /100 | #333 | Tragic 3.10 |
| Lithuanians | 0.0 /100 | #334 | Tragic 3.10 |
| Luxembourgers | 0.0 /100 | #335 | Tragic 3.10 |
| Irish | 0.0 /100 | #336 | Tragic 3.10 |
| Swedes | 0.0 /100 | #337 | Tragic 3.10 |
| French | 0.0 /100 | #338 | Tragic 3.10 |
| Croatians | 0.0 /100 | #339 | Tragic 3.10 |
| Finns | 0.0 /100 | #340 | Tragic 3.09 |
| Poles | 0.0 /100 | #341 | Tragic 3.09 |
| Germans | 0.0 /100 | #342 | Tragic 3.09 |
| Norwegians | 0.0 /100 | #343 | Tragic 3.08 |
| French Canadians | 0.0 /100 | #344 | Tragic 3.07 |
| Slovenes | 0.0 /100 | #345 | Tragic 3.07 |
| Slovaks | 0.0 /100 | #346 | Tragic 3.06 |
| Carpatho Rusyns | 0.0 /100 | #347 | Tragic 3.06 |