Swiss vs Polish No Schooling Completed
COMPARE
Swiss
Polish
No Schooling Completed
No Schooling Completed Comparison
Swiss
Poles
1.5%
NO SCHOOLING COMPLETED
100.0/ 100
METRIC RATING
32nd/ 347
METRIC RANK
1.4%
NO SCHOOLING COMPLETED
100.0/ 100
METRIC RATING
13th/ 347
METRIC RANK
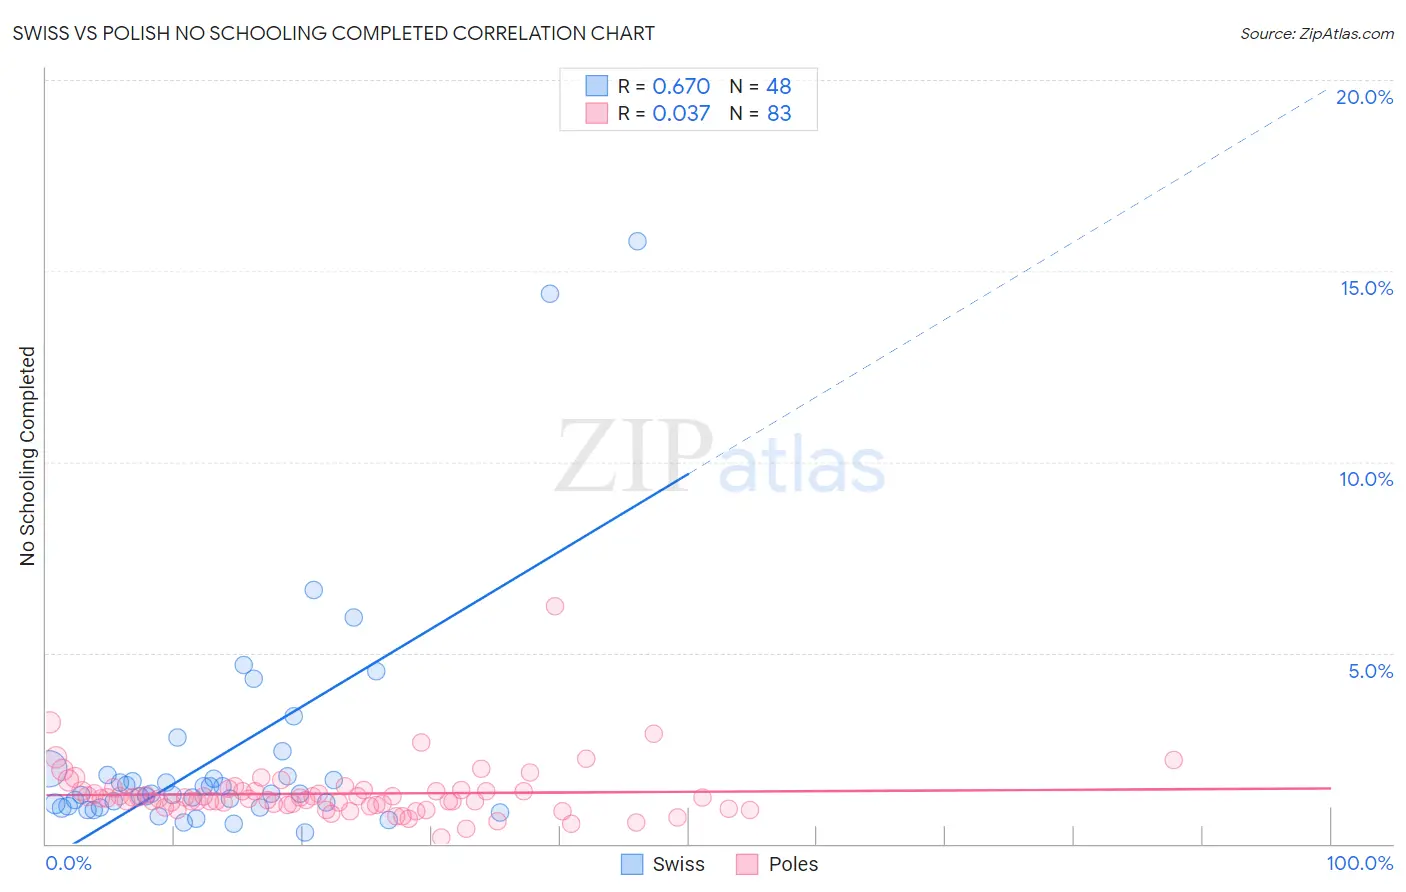
Swiss vs Polish No Schooling Completed Correlation Chart
The statistical analysis conducted on geographies consisting of 455,291,102 people shows a significant positive correlation between the proportion of Swiss and percentage of population with no schooling in the United States with a correlation coefficient (R) of 0.670 and weighted average of 1.5%. Similarly, the statistical analysis conducted on geographies consisting of 543,036,846 people shows no correlation between the proportion of Poles and percentage of population with no schooling in the United States with a correlation coefficient (R) of 0.037 and weighted average of 1.4%, a difference of 6.3%.
No Schooling Completed Correlation Summary
| Measurement | Swiss | Polish |
| Minimum | 0.31% | 0.16% |
| Maximum | 15.8% | 6.2% |
| Range | 15.5% | 6.1% |
| Mean | 2.3% | 1.3% |
| Median | 1.3% | 1.2% |
| Interquartile 25% (IQ1) | 0.97% | 1.00% |
| Interquartile 75% (IQ3) | 1.8% | 1.4% |
| Interquartile Range (IQR) | 0.82% | 0.39% |
| Standard Deviation (Sample) | 3.0% | 0.74% |
| Standard Deviation (Population) | 3.0% | 0.74% |
Demographics Similar to Swiss and Poles by No Schooling Completed
In terms of no schooling completed, the demographic groups most similar to Swiss are Inupiat (1.5%, a difference of 0.39%), British (1.5%, a difference of 0.42%), Lumbee (1.5%, a difference of 0.91%), French Canadian (1.5%, a difference of 1.8%), and Scandinavian (1.5%, a difference of 1.8%). Similarly, the demographic groups most similar to Poles are Irish (1.4%, a difference of 0.030%), Scotch-Irish (1.5%, a difference of 0.94%), Tlingit-Haida (1.5%, a difference of 1.0%), Finnish (1.5%, a difference of 1.5%), and Croatian (1.5%, a difference of 1.5%).
| Demographics | Rating | Rank | No Schooling Completed |
| Irish | 100.0 /100 | #12 | Exceptional 1.4% |
| Poles | 100.0 /100 | #13 | Exceptional 1.4% |
| Scotch-Irish | 100.0 /100 | #14 | Exceptional 1.5% |
| Tlingit-Haida | 100.0 /100 | #15 | Exceptional 1.5% |
| Finns | 100.0 /100 | #16 | Exceptional 1.5% |
| Croatians | 100.0 /100 | #17 | Exceptional 1.5% |
| Danes | 100.0 /100 | #18 | Exceptional 1.5% |
| Alaskan Athabascans | 100.0 /100 | #19 | Exceptional 1.5% |
| Welsh | 100.0 /100 | #20 | Exceptional 1.5% |
| Chinese | 100.0 /100 | #21 | Exceptional 1.5% |
| Alaska Natives | 100.0 /100 | #22 | Exceptional 1.5% |
| Europeans | 100.0 /100 | #23 | Exceptional 1.5% |
| Pennsylvania Germans | 100.0 /100 | #24 | Exceptional 1.5% |
| French | 100.0 /100 | #25 | Exceptional 1.5% |
| Czechs | 100.0 /100 | #26 | Exceptional 1.5% |
| Scandinavians | 100.0 /100 | #27 | Exceptional 1.5% |
| French Canadians | 100.0 /100 | #28 | Exceptional 1.5% |
| Lumbee | 100.0 /100 | #29 | Exceptional 1.5% |
| British | 100.0 /100 | #30 | Exceptional 1.5% |
| Inupiat | 100.0 /100 | #31 | Exceptional 1.5% |
| Swiss | 100.0 /100 | #32 | Exceptional 1.5% |