Immigrants from Eritrea vs Polish Average Family Size
COMPARE
Immigrants from Eritrea
Polish
Average Family Size
Average Family Size Comparison
Immigrants from Eritrea
Poles
3.24
AVERAGE FAMILY SIZE
71.4/ 100
METRIC RATING
153rd/ 347
METRIC RANK
3.09
AVERAGE FAMILY SIZE
0.0/ 100
METRIC RATING
341st/ 347
METRIC RANK
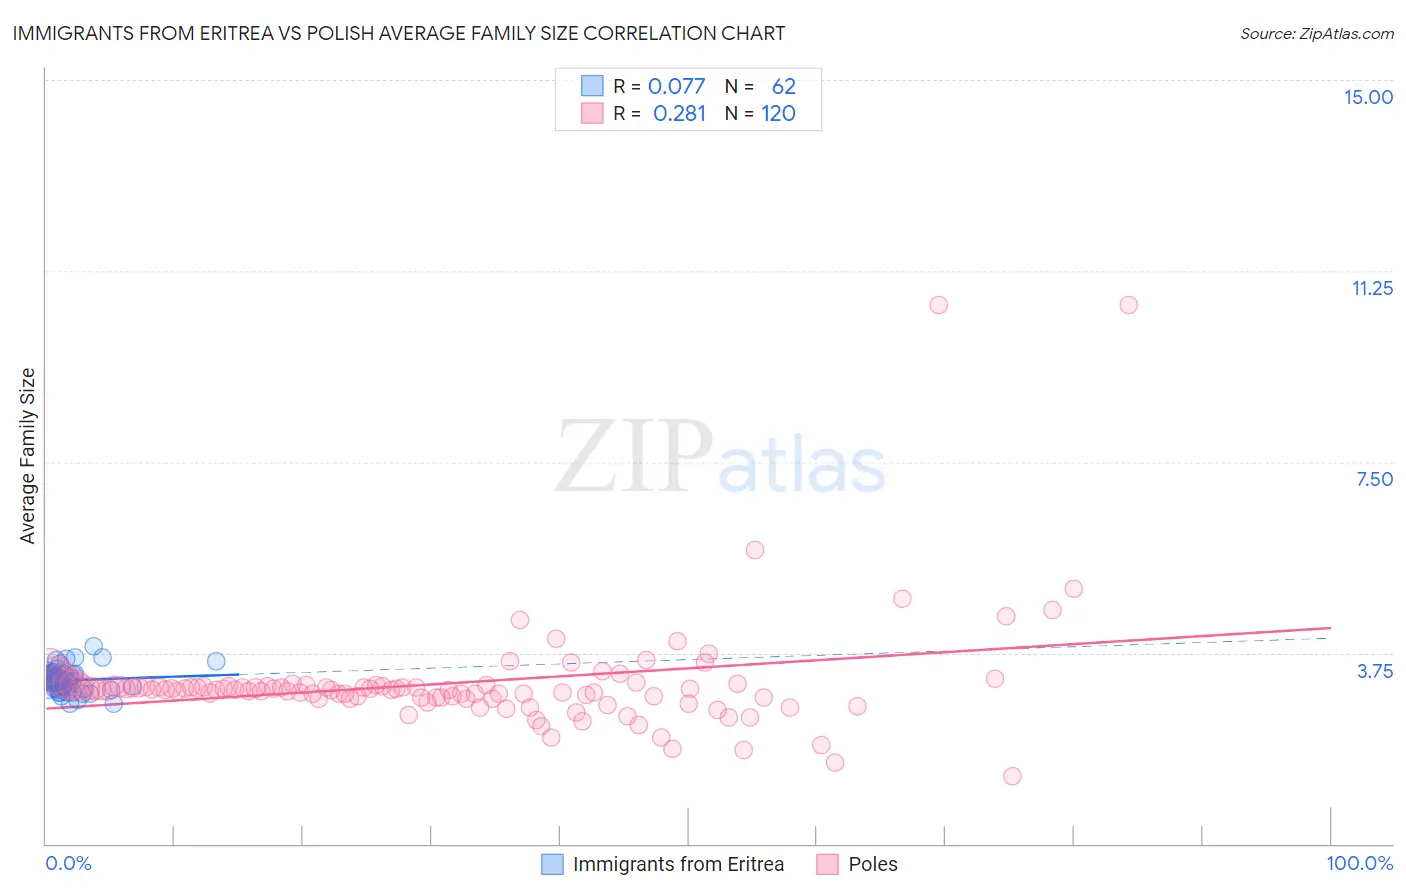
Immigrants from Eritrea vs Polish Average Family Size Correlation Chart
The statistical analysis conducted on geographies consisting of 104,794,375 people shows a slight positive correlation between the proportion of Immigrants from Eritrea and average family size in the United States with a correlation coefficient (R) of 0.077 and weighted average of 3.24. Similarly, the statistical analysis conducted on geographies consisting of 559,976,913 people shows a weak positive correlation between the proportion of Poles and average family size in the United States with a correlation coefficient (R) of 0.281 and weighted average of 3.09, a difference of 4.8%.
Average Family Size Correlation Summary
| Measurement | Immigrants from Eritrea | Polish |
| Minimum | 2.75 | 1.32 |
| Maximum | 3.89 | 10.58 |
| Range | 1.14 | 9.26 |
| Mean | 3.21 | 3.15 |
| Median | 3.21 | 3.03 |
| Interquartile 25% (IQ1) | 3.05 | 2.87 |
| Interquartile 75% (IQ3) | 3.31 | 3.10 |
| Interquartile Range (IQR) | 0.25 | 0.23 |
| Standard Deviation (Sample) | 0.22 | 1.13 |
| Standard Deviation (Population) | 0.22 | 1.13 |
Similar Demographics by Average Family Size
Demographics Similar to Immigrants from Eritrea by Average Family Size
In terms of average family size, the demographic groups most similar to Immigrants from Eritrea are Spanish American (3.24, a difference of 0.020%), Immigrants from Egypt (3.24, a difference of 0.030%), Assyrian/Chaldean/Syriac (3.24, a difference of 0.050%), Indian (Asian) (3.24, a difference of 0.050%), and Jordanian (3.24, a difference of 0.050%).
| Demographics | Rating | Rank | Average Family Size |
| Immigrants | Africa | 77.9 /100 | #146 | Good 3.25 |
| Immigrants | Jordan | 75.7 /100 | #147 | Good 3.24 |
| Blackfeet | 75.0 /100 | #148 | Good 3.24 |
| Assyrians/Chaldeans/Syriacs | 73.8 /100 | #149 | Good 3.24 |
| Indians (Asian) | 73.6 /100 | #150 | Good 3.24 |
| Jordanians | 73.5 /100 | #151 | Good 3.24 |
| Spanish Americans | 72.5 /100 | #152 | Good 3.24 |
| Immigrants | Eritrea | 71.4 /100 | #153 | Good 3.24 |
| Immigrants | Egypt | 70.0 /100 | #154 | Good 3.24 |
| Seminole | 68.2 /100 | #155 | Good 3.24 |
| Immigrants | Taiwan | 68.1 /100 | #156 | Good 3.24 |
| Immigrants | Uzbekistan | 67.0 /100 | #157 | Good 3.24 |
| Iraqis | 64.3 /100 | #158 | Good 3.24 |
| Ethiopians | 63.9 /100 | #159 | Good 3.24 |
| Immigrants | Iraq | 63.7 /100 | #160 | Good 3.24 |
Demographics Similar to Poles by Average Family Size
In terms of average family size, the demographic groups most similar to Poles are Finnish (3.09, a difference of 0.050%), German (3.09, a difference of 0.14%), Croatian (3.10, a difference of 0.19%), French (3.10, a difference of 0.21%), and Swedish (3.10, a difference of 0.23%).
| Demographics | Rating | Rank | Average Family Size |
| Estonians | 0.0 /100 | #333 | Tragic 3.10 |
| Lithuanians | 0.0 /100 | #334 | Tragic 3.10 |
| Luxembourgers | 0.0 /100 | #335 | Tragic 3.10 |
| Irish | 0.0 /100 | #336 | Tragic 3.10 |
| Swedes | 0.0 /100 | #337 | Tragic 3.10 |
| French | 0.0 /100 | #338 | Tragic 3.10 |
| Croatians | 0.0 /100 | #339 | Tragic 3.10 |
| Finns | 0.0 /100 | #340 | Tragic 3.09 |
| Poles | 0.0 /100 | #341 | Tragic 3.09 |
| Germans | 0.0 /100 | #342 | Tragic 3.09 |
| Norwegians | 0.0 /100 | #343 | Tragic 3.08 |
| French Canadians | 0.0 /100 | #344 | Tragic 3.07 |
| Slovenes | 0.0 /100 | #345 | Tragic 3.07 |
| Slovaks | 0.0 /100 | #346 | Tragic 3.06 |
| Carpatho Rusyns | 0.0 /100 | #347 | Tragic 3.06 |