Swiss vs Polish Unemployment Among Ages 60 to 64 years
COMPARE
Swiss
Polish
Unemployment Among Ages 60 to 64 years
Unemployment Among Ages 60 to 64 years Comparison
Swiss
Poles
4.6%
UNEMPLOYMENT AMONG AGES 60 TO 64 YEARS
99.8/ 100
METRIC RATING
59th/ 347
METRIC RANK
4.7%
UNEMPLOYMENT AMONG AGES 60 TO 64 YEARS
98.1/ 100
METRIC RATING
96th/ 347
METRIC RANK
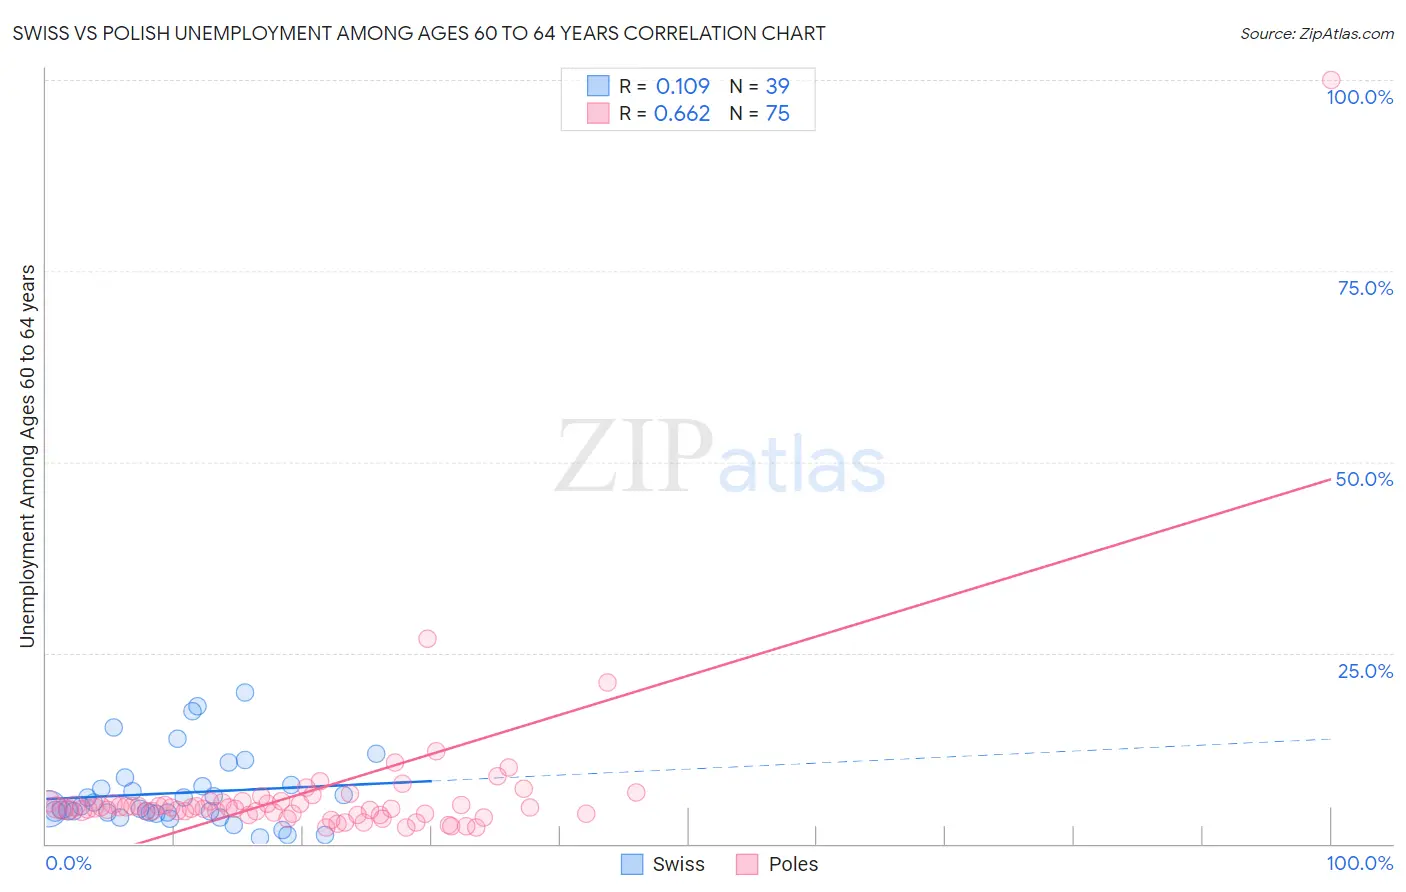
Swiss vs Polish Unemployment Among Ages 60 to 64 years Correlation Chart
The statistical analysis conducted on geographies consisting of 401,314,393 people shows a poor positive correlation between the proportion of Swiss and unemployment rate among population between the ages 60 and 64 in the United States with a correlation coefficient (R) of 0.109 and weighted average of 4.6%. Similarly, the statistical analysis conducted on geographies consisting of 461,022,460 people shows a significant positive correlation between the proportion of Poles and unemployment rate among population between the ages 60 and 64 in the United States with a correlation coefficient (R) of 0.662 and weighted average of 4.7%, a difference of 2.2%.
Unemployment Among Ages 60 to 64 years Correlation Summary
| Measurement | Swiss | Polish |
| Minimum | 0.90% | 2.1% |
| Maximum | 19.8% | 100.0% |
| Range | 18.9% | 97.9% |
| Mean | 6.7% | 6.6% |
| Median | 4.7% | 4.7% |
| Interquartile 25% (IQ1) | 4.1% | 3.9% |
| Interquartile 75% (IQ3) | 7.7% | 5.5% |
| Interquartile Range (IQR) | 3.6% | 1.6% |
| Standard Deviation (Sample) | 4.7% | 11.5% |
| Standard Deviation (Population) | 4.7% | 11.4% |
Similar Demographics by Unemployment Among Ages 60 to 64 years
Demographics Similar to Swiss by Unemployment Among Ages 60 to 64 years
In terms of unemployment among ages 60 to 64 years, the demographic groups most similar to Swiss are Puget Sound Salish (4.6%, a difference of 0.020%), Immigrants from India (4.6%, a difference of 0.10%), British (4.6%, a difference of 0.15%), Welsh (4.6%, a difference of 0.16%), and Bangladeshi (4.6%, a difference of 0.25%).
| Demographics | Rating | Rank | Unemployment Among Ages 60 to 64 years |
| Kenyans | 99.9 /100 | #52 | Exceptional 4.6% |
| Immigrants | Moldova | 99.9 /100 | #53 | Exceptional 4.6% |
| Dutch | 99.9 /100 | #54 | Exceptional 4.6% |
| Bangladeshis | 99.9 /100 | #55 | Exceptional 4.6% |
| Welsh | 99.9 /100 | #56 | Exceptional 4.6% |
| British | 99.9 /100 | #57 | Exceptional 4.6% |
| Immigrants | India | 99.8 /100 | #58 | Exceptional 4.6% |
| Swiss | 99.8 /100 | #59 | Exceptional 4.6% |
| Puget Sound Salish | 99.8 /100 | #60 | Exceptional 4.6% |
| Lebanese | 99.8 /100 | #61 | Exceptional 4.6% |
| Senegalese | 99.7 /100 | #62 | Exceptional 4.6% |
| Czechoslovakians | 99.7 /100 | #63 | Exceptional 4.6% |
| Immigrants | Middle Africa | 99.7 /100 | #64 | Exceptional 4.6% |
| Jordanians | 99.7 /100 | #65 | Exceptional 4.6% |
| Hawaiians | 99.6 /100 | #66 | Exceptional 4.6% |
Demographics Similar to Poles by Unemployment Among Ages 60 to 64 years
In terms of unemployment among ages 60 to 64 years, the demographic groups most similar to Poles are Serbian (4.7%, a difference of 0.010%), Immigrants from Kuwait (4.7%, a difference of 0.090%), Immigrants from Albania (4.7%, a difference of 0.090%), Somali (4.7%, a difference of 0.090%), and Egyptian (4.7%, a difference of 0.090%).
| Demographics | Rating | Rank | Unemployment Among Ages 60 to 64 years |
| Immigrants | Northern Africa | 98.7 /100 | #89 | Exceptional 4.7% |
| Immigrants | Liberia | 98.7 /100 | #90 | Exceptional 4.7% |
| Immigrants | Uganda | 98.4 /100 | #91 | Exceptional 4.7% |
| Romanians | 98.4 /100 | #92 | Exceptional 4.7% |
| Immigrants | Saudi Arabia | 98.3 /100 | #93 | Exceptional 4.7% |
| Immigrants | Kuwait | 98.3 /100 | #94 | Exceptional 4.7% |
| Serbians | 98.2 /100 | #95 | Exceptional 4.7% |
| Poles | 98.1 /100 | #96 | Exceptional 4.7% |
| Immigrants | Albania | 98.0 /100 | #97 | Exceptional 4.7% |
| Somalis | 98.0 /100 | #98 | Exceptional 4.7% |
| Egyptians | 98.0 /100 | #99 | Exceptional 4.7% |
| Portuguese | 97.9 /100 | #100 | Exceptional 4.7% |
| Malaysians | 97.9 /100 | #101 | Exceptional 4.7% |
| Immigrants | Canada | 97.8 /100 | #102 | Exceptional 4.7% |
| Whites/Caucasians | 97.8 /100 | #103 | Exceptional 4.7% |