Sudanese vs Immigrants from Thailand Average Family Size
COMPARE
Sudanese
Immigrants from Thailand
Average Family Size
Average Family Size Comparison
Sudanese
Immigrants from Thailand
3.20
AVERAGE FAMILY SIZE
13.3/ 100
METRIC RATING
209th/ 347
METRIC RANK
3.27
AVERAGE FAMILY SIZE
93.3/ 100
METRIC RATING
121st/ 347
METRIC RANK
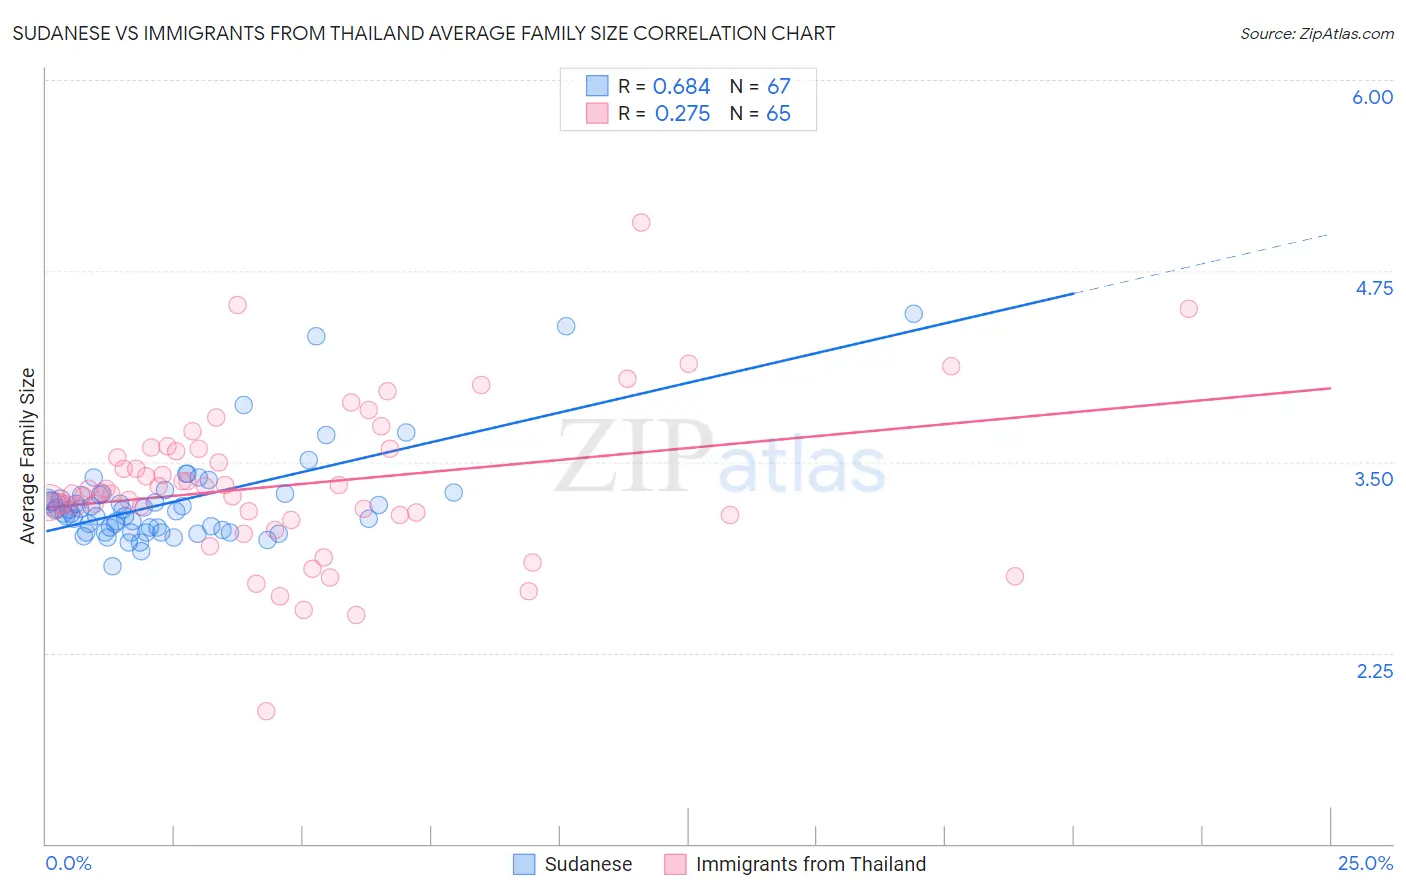
Sudanese vs Immigrants from Thailand Average Family Size Correlation Chart
The statistical analysis conducted on geographies consisting of 110,078,191 people shows a significant positive correlation between the proportion of Sudanese and average family size in the United States with a correlation coefficient (R) of 0.684 and weighted average of 3.20. Similarly, the statistical analysis conducted on geographies consisting of 316,926,842 people shows a weak positive correlation between the proportion of Immigrants from Thailand and average family size in the United States with a correlation coefficient (R) of 0.275 and weighted average of 3.27, a difference of 2.1%.
Average Family Size Correlation Summary
| Measurement | Sudanese | Immigrants from Thailand |
| Minimum | 2.82 | 1.87 |
| Maximum | 4.47 | 5.07 |
| Range | 1.65 | 3.20 |
| Mean | 3.24 | 3.35 |
| Median | 3.18 | 3.30 |
| Interquartile 25% (IQ1) | 3.05 | 3.15 |
| Interquartile 75% (IQ3) | 3.28 | 3.59 |
| Interquartile Range (IQR) | 0.23 | 0.44 |
| Standard Deviation (Sample) | 0.31 | 0.51 |
| Standard Deviation (Population) | 0.31 | 0.51 |
Similar Demographics by Average Family Size
Demographics Similar to Sudanese by Average Family Size
In terms of average family size, the demographic groups most similar to Sudanese are Chippewa (3.20, a difference of 0.0%), Filipino (3.20, a difference of 0.010%), Zimbabwean (3.20, a difference of 0.030%), Immigrants from Iran (3.20, a difference of 0.050%), and Creek (3.20, a difference of 0.050%).
| Demographics | Rating | Rank | Average Family Size |
| Immigrants | India | 18.5 /100 | #202 | Poor 3.21 |
| Immigrants | Nepal | 18.1 /100 | #203 | Poor 3.21 |
| Immigrants | Poland | 16.6 /100 | #204 | Poor 3.20 |
| Paraguayans | 16.3 /100 | #205 | Poor 3.20 |
| Immigrants | Cabo Verde | 16.0 /100 | #206 | Poor 3.20 |
| Filipinos | 13.6 /100 | #207 | Poor 3.20 |
| Chippewa | 13.3 /100 | #208 | Poor 3.20 |
| Sudanese | 13.3 /100 | #209 | Poor 3.20 |
| Zimbabweans | 12.6 /100 | #210 | Poor 3.20 |
| Immigrants | Iran | 12.1 /100 | #211 | Poor 3.20 |
| Creek | 12.1 /100 | #212 | Poor 3.20 |
| Mongolians | 11.5 /100 | #213 | Poor 3.20 |
| Somalis | 11.2 /100 | #214 | Poor 3.20 |
| Delaware | 11.1 /100 | #215 | Poor 3.20 |
| Bermudans | 11.0 /100 | #216 | Poor 3.20 |
Demographics Similar to Immigrants from Thailand by Average Family Size
In terms of average family size, the demographic groups most similar to Immigrants from Thailand are Immigrants from Bahamas (3.27, a difference of 0.020%), Immigrants from Colombia (3.27, a difference of 0.030%), Immigrants from Indonesia (3.27, a difference of 0.040%), Immigrants from Asia (3.27, a difference of 0.050%), and Alaskan Athabascan (3.27, a difference of 0.060%).
| Demographics | Rating | Rank | Average Family Size |
| South Americans | 95.1 /100 | #114 | Exceptional 3.27 |
| Immigrants | Liberia | 95.0 /100 | #115 | Exceptional 3.27 |
| Immigrants | South America | 95.0 /100 | #116 | Exceptional 3.27 |
| Kiowa | 94.8 /100 | #117 | Exceptional 3.27 |
| Immigrants | Asia | 94.0 /100 | #118 | Exceptional 3.27 |
| Immigrants | Indonesia | 93.7 /100 | #119 | Exceptional 3.27 |
| Immigrants | Bahamas | 93.6 /100 | #120 | Exceptional 3.27 |
| Immigrants | Thailand | 93.3 /100 | #121 | Exceptional 3.27 |
| Immigrants | Colombia | 92.8 /100 | #122 | Exceptional 3.27 |
| Alaskan Athabascans | 92.4 /100 | #123 | Exceptional 3.27 |
| South American Indians | 91.6 /100 | #124 | Exceptional 3.26 |
| Immigrants | Cuba | 91.3 /100 | #125 | Exceptional 3.26 |
| Immigrants | Costa Rica | 90.7 /100 | #126 | Exceptional 3.26 |
| Immigrants | Syria | 90.6 /100 | #127 | Exceptional 3.26 |
| Colombians | 89.9 /100 | #128 | Excellent 3.26 |