Sudanese vs Immigrants from Thailand Householder Income Ages 25 - 44 years
COMPARE
Sudanese
Immigrants from Thailand
Householder Income Ages 25 - 44 years
Householder Income Ages 25 - 44 years Comparison
Sudanese
Immigrants from Thailand
$84,401
HOUSEHOLDER INCOME AGES 25 - 44 YEARS
0.4/ 100
METRIC RATING
265th/ 347
METRIC RANK
$91,337
HOUSEHOLDER INCOME AGES 25 - 44 YEARS
14.3/ 100
METRIC RATING
208th/ 347
METRIC RANK
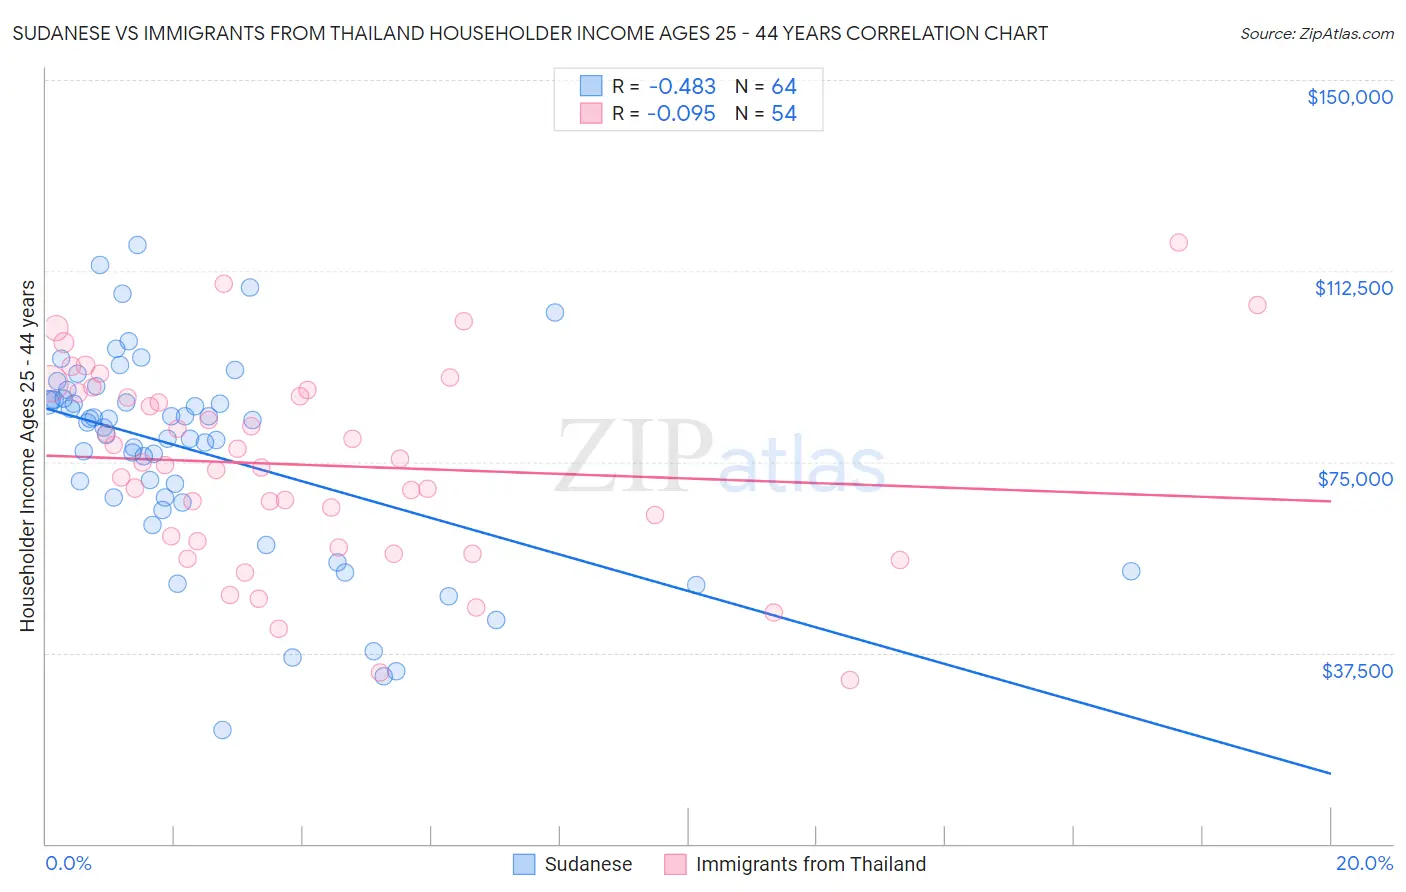
Sudanese vs Immigrants from Thailand Householder Income Ages 25 - 44 years Correlation Chart
The statistical analysis conducted on geographies consisting of 110,044,809 people shows a moderate negative correlation between the proportion of Sudanese and household income with householder between the ages 25 and 44 in the United States with a correlation coefficient (R) of -0.483 and weighted average of $84,401. Similarly, the statistical analysis conducted on geographies consisting of 316,454,000 people shows a slight negative correlation between the proportion of Immigrants from Thailand and household income with householder between the ages 25 and 44 in the United States with a correlation coefficient (R) of -0.095 and weighted average of $91,337, a difference of 8.2%.
Householder Income Ages 25 - 44 years Correlation Summary
| Measurement | Sudanese | Immigrants from Thailand |
| Minimum | $22,303 | $32,083 |
| Maximum | $117,632 | $118,125 |
| Range | $95,330 | $86,042 |
| Mean | $76,942 | $74,382 |
| Median | $82,204 | $74,631 |
| Interquartile 25% (IQ1) | $67,535 | $59,491 |
| Interquartile 75% (IQ3) | $87,340 | $88,604 |
| Interquartile Range (IQR) | $19,805 | $29,112 |
| Standard Deviation (Sample) | $20,185 | $19,277 |
| Standard Deviation (Population) | $20,027 | $19,098 |
Similar Demographics by Householder Income Ages 25 - 44 years
Demographics Similar to Sudanese by Householder Income Ages 25 - 44 years
In terms of householder income ages 25 - 44 years, the demographic groups most similar to Sudanese are Osage ($84,461, a difference of 0.070%), Immigrants from Cabo Verde ($84,304, a difference of 0.12%), Belizean ($84,534, a difference of 0.16%), Hmong ($84,258, a difference of 0.17%), and Cree ($84,574, a difference of 0.20%).
| Demographics | Rating | Rank | Householder Income Ages 25 - 44 years |
| Immigrants | Nicaragua | 0.5 /100 | #258 | Tragic $84,914 |
| Immigrants | Senegal | 0.5 /100 | #259 | Tragic $84,848 |
| Americans | 0.4 /100 | #260 | Tragic $84,791 |
| Inupiat | 0.4 /100 | #261 | Tragic $84,619 |
| Cree | 0.4 /100 | #262 | Tragic $84,574 |
| Belizeans | 0.4 /100 | #263 | Tragic $84,534 |
| Osage | 0.4 /100 | #264 | Tragic $84,461 |
| Sudanese | 0.4 /100 | #265 | Tragic $84,401 |
| Immigrants | Cabo Verde | 0.3 /100 | #266 | Tragic $84,304 |
| Hmong | 0.3 /100 | #267 | Tragic $84,258 |
| Sub-Saharan Africans | 0.3 /100 | #268 | Tragic $84,235 |
| Spanish American Indians | 0.3 /100 | #269 | Tragic $84,085 |
| Jamaicans | 0.3 /100 | #270 | Tragic $83,933 |
| Somalis | 0.2 /100 | #271 | Tragic $83,752 |
| Spanish Americans | 0.2 /100 | #272 | Tragic $83,722 |
Demographics Similar to Immigrants from Thailand by Householder Income Ages 25 - 44 years
In terms of householder income ages 25 - 44 years, the demographic groups most similar to Immigrants from Thailand are Yugoslavian ($91,368, a difference of 0.030%), Aleut ($91,370, a difference of 0.040%), Immigrants from Eastern Africa ($91,458, a difference of 0.13%), Nepalese ($91,498, a difference of 0.18%), and Immigrants from Uruguay ($91,171, a difference of 0.18%).
| Demographics | Rating | Rank | Householder Income Ages 25 - 44 years |
| Japanese | 16.4 /100 | #201 | Poor $91,624 |
| Ecuadorians | 16.0 /100 | #202 | Poor $91,574 |
| Immigrants | Cambodia | 15.7 /100 | #203 | Poor $91,533 |
| Nepalese | 15.4 /100 | #204 | Poor $91,498 |
| Immigrants | Eastern Africa | 15.2 /100 | #205 | Poor $91,458 |
| Aleuts | 14.5 /100 | #206 | Poor $91,370 |
| Yugoslavians | 14.5 /100 | #207 | Poor $91,368 |
| Immigrants | Thailand | 14.3 /100 | #208 | Poor $91,337 |
| Immigrants | Uruguay | 13.2 /100 | #209 | Poor $91,171 |
| Immigrants | Kenya | 10.9 /100 | #210 | Poor $90,767 |
| Iraqis | 10.8 /100 | #211 | Poor $90,764 |
| Hawaiians | 10.6 /100 | #212 | Poor $90,722 |
| Immigrants | Bangladesh | 9.3 /100 | #213 | Tragic $90,448 |
| Immigrants | Africa | 8.9 /100 | #214 | Tragic $90,372 |
| Panamanians | 8.1 /100 | #215 | Tragic $90,193 |