Sudanese vs Immigrants from Grenada Average Family Size
COMPARE
Sudanese
Immigrants from Grenada
Average Family Size
Average Family Size Comparison
Sudanese
Immigrants from Grenada
3.20
AVERAGE FAMILY SIZE
13.3/ 100
METRIC RATING
209th/ 347
METRIC RANK
3.34
AVERAGE FAMILY SIZE
100.0/ 100
METRIC RATING
62nd/ 347
METRIC RANK
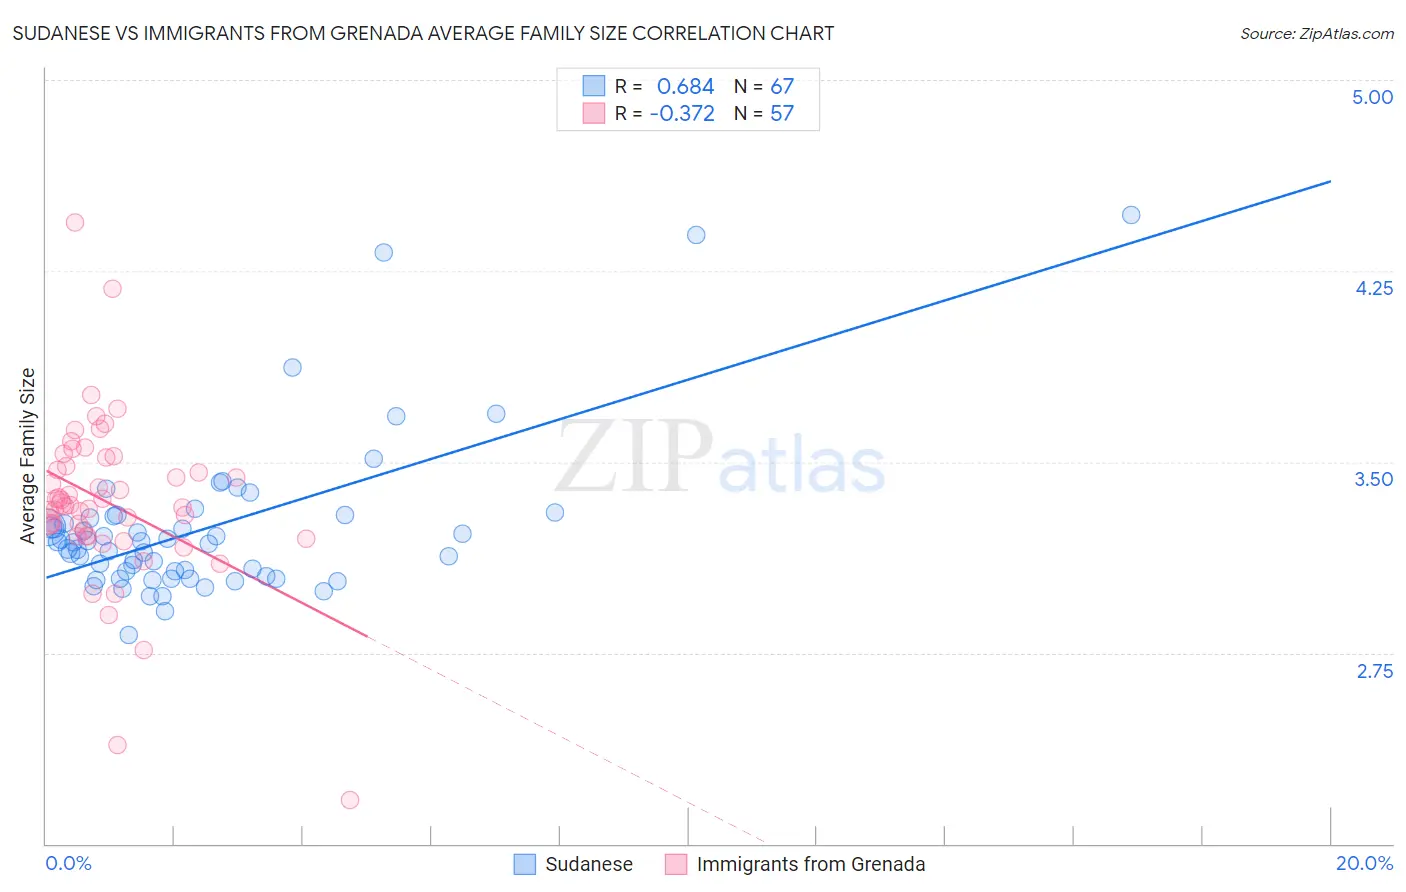
Sudanese vs Immigrants from Grenada Average Family Size Correlation Chart
The statistical analysis conducted on geographies consisting of 110,078,191 people shows a significant positive correlation between the proportion of Sudanese and average family size in the United States with a correlation coefficient (R) of 0.684 and weighted average of 3.20. Similarly, the statistical analysis conducted on geographies consisting of 67,189,874 people shows a mild negative correlation between the proportion of Immigrants from Grenada and average family size in the United States with a correlation coefficient (R) of -0.372 and weighted average of 3.34, a difference of 4.4%.
Average Family Size Correlation Summary
| Measurement | Sudanese | Immigrants from Grenada |
| Minimum | 2.82 | 2.17 |
| Maximum | 4.47 | 4.44 |
| Range | 1.65 | 2.27 |
| Mean | 3.24 | 3.34 |
| Median | 3.18 | 3.33 |
| Interquartile 25% (IQ1) | 3.05 | 3.21 |
| Interquartile 75% (IQ3) | 3.28 | 3.50 |
| Interquartile Range (IQR) | 0.23 | 0.29 |
| Standard Deviation (Sample) | 0.31 | 0.34 |
| Standard Deviation (Population) | 0.31 | 0.33 |
Similar Demographics by Average Family Size
Demographics Similar to Sudanese by Average Family Size
In terms of average family size, the demographic groups most similar to Sudanese are Chippewa (3.20, a difference of 0.0%), Filipino (3.20, a difference of 0.010%), Zimbabwean (3.20, a difference of 0.030%), Immigrants from Iran (3.20, a difference of 0.050%), and Creek (3.20, a difference of 0.050%).
| Demographics | Rating | Rank | Average Family Size |
| Immigrants | India | 18.5 /100 | #202 | Poor 3.21 |
| Immigrants | Nepal | 18.1 /100 | #203 | Poor 3.21 |
| Immigrants | Poland | 16.6 /100 | #204 | Poor 3.20 |
| Paraguayans | 16.3 /100 | #205 | Poor 3.20 |
| Immigrants | Cabo Verde | 16.0 /100 | #206 | Poor 3.20 |
| Filipinos | 13.6 /100 | #207 | Poor 3.20 |
| Chippewa | 13.3 /100 | #208 | Poor 3.20 |
| Sudanese | 13.3 /100 | #209 | Poor 3.20 |
| Zimbabweans | 12.6 /100 | #210 | Poor 3.20 |
| Immigrants | Iran | 12.1 /100 | #211 | Poor 3.20 |
| Creek | 12.1 /100 | #212 | Poor 3.20 |
| Mongolians | 11.5 /100 | #213 | Poor 3.20 |
| Somalis | 11.2 /100 | #214 | Poor 3.20 |
| Delaware | 11.1 /100 | #215 | Poor 3.20 |
| Bermudans | 11.0 /100 | #216 | Poor 3.20 |
Demographics Similar to Immigrants from Grenada by Average Family Size
In terms of average family size, the demographic groups most similar to Immigrants from Grenada are Chinese (3.34, a difference of 0.020%), Dominican (3.34, a difference of 0.090%), Immigrants from Laos (3.34, a difference of 0.11%), Immigrants from St. Vincent and the Grenadines (3.34, a difference of 0.17%), and Central American Indian (3.35, a difference of 0.19%).
| Demographics | Rating | Rank | Average Family Size |
| Immigrants | Honduras | 100.0 /100 | #55 | Exceptional 3.36 |
| Immigrants | Dominican Republic | 100.0 /100 | #56 | Exceptional 3.35 |
| Sri Lankans | 100.0 /100 | #57 | Exceptional 3.35 |
| Hondurans | 100.0 /100 | #58 | Exceptional 3.35 |
| Japanese | 100.0 /100 | #59 | Exceptional 3.35 |
| Immigrants | Armenia | 100.0 /100 | #60 | Exceptional 3.35 |
| Central American Indians | 100.0 /100 | #61 | Exceptional 3.35 |
| Immigrants | Grenada | 100.0 /100 | #62 | Exceptional 3.34 |
| Chinese | 100.0 /100 | #63 | Exceptional 3.34 |
| Dominicans | 99.9 /100 | #64 | Exceptional 3.34 |
| Immigrants | Laos | 99.9 /100 | #65 | Exceptional 3.34 |
| Immigrants | St. Vincent and the Grenadines | 99.9 /100 | #66 | Exceptional 3.34 |
| Immigrants | Jamaica | 99.9 /100 | #67 | Exceptional 3.33 |
| Immigrants | Cambodia | 99.9 /100 | #68 | Exceptional 3.33 |
| Immigrants | Immigrants | 99.9 /100 | #69 | Exceptional 3.33 |