Cuban vs Immigrants from Thailand Average Family Size
COMPARE
Cuban
Immigrants from Thailand
Average Family Size
Average Family Size Comparison
Cubans
Immigrants from Thailand
3.25
AVERAGE FAMILY SIZE
81.8/ 100
METRIC RATING
138th/ 347
METRIC RANK
3.27
AVERAGE FAMILY SIZE
93.3/ 100
METRIC RATING
121st/ 347
METRIC RANK
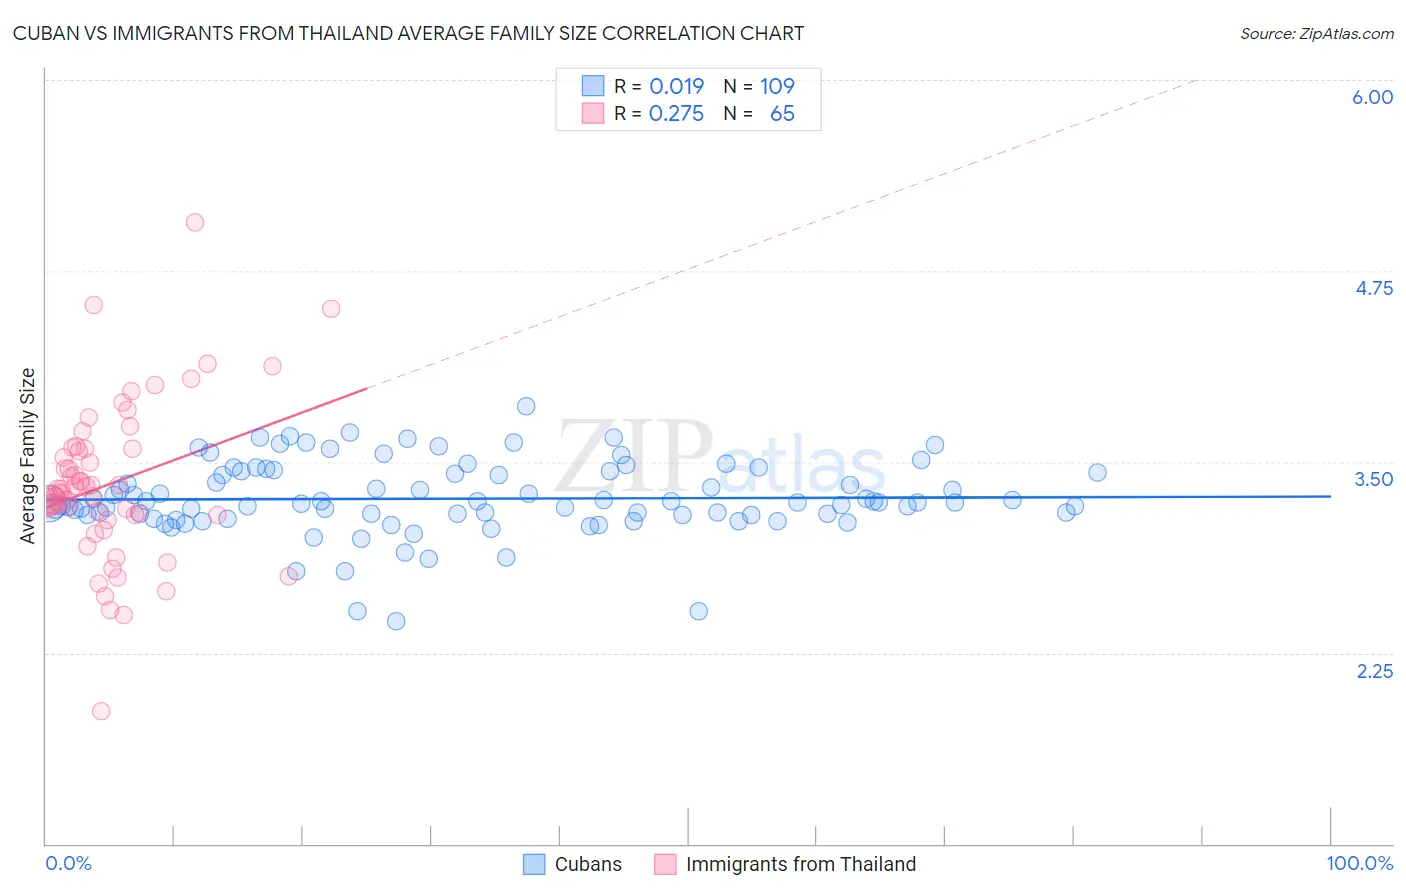
Cuban vs Immigrants from Thailand Average Family Size Correlation Chart
The statistical analysis conducted on geographies consisting of 448,974,535 people shows no correlation between the proportion of Cubans and average family size in the United States with a correlation coefficient (R) of 0.019 and weighted average of 3.25. Similarly, the statistical analysis conducted on geographies consisting of 316,926,842 people shows a weak positive correlation between the proportion of Immigrants from Thailand and average family size in the United States with a correlation coefficient (R) of 0.275 and weighted average of 3.27, a difference of 0.51%.
Average Family Size Correlation Summary
| Measurement | Cuban | Immigrants from Thailand |
| Minimum | 2.46 | 1.87 |
| Maximum | 3.87 | 5.07 |
| Range | 1.41 | 3.20 |
| Mean | 3.26 | 3.35 |
| Median | 3.23 | 3.30 |
| Interquartile 25% (IQ1) | 3.15 | 3.15 |
| Interquartile 75% (IQ3) | 3.43 | 3.59 |
| Interquartile Range (IQR) | 0.28 | 0.44 |
| Standard Deviation (Sample) | 0.24 | 0.51 |
| Standard Deviation (Population) | 0.24 | 0.51 |
Demographics Similar to Cubans and Immigrants from Thailand by Average Family Size
In terms of average family size, the demographic groups most similar to Cubans are Immigrants from Ethiopia (3.25, a difference of 0.010%), Immigrants from Middle Africa (3.25, a difference of 0.020%), Comanche (3.25, a difference of 0.030%), Panamanian (3.25, a difference of 0.080%), and African (3.25, a difference of 0.10%). Similarly, the demographic groups most similar to Immigrants from Thailand are Immigrants from Bahamas (3.27, a difference of 0.020%), Immigrants from Colombia (3.27, a difference of 0.030%), Immigrants from Indonesia (3.27, a difference of 0.040%), Alaskan Athabascan (3.27, a difference of 0.060%), and South American Indian (3.26, a difference of 0.11%).
| Demographics | Rating | Rank | Average Family Size |
| Immigrants | Indonesia | 93.7 /100 | #119 | Exceptional 3.27 |
| Immigrants | Bahamas | 93.6 /100 | #120 | Exceptional 3.27 |
| Immigrants | Thailand | 93.3 /100 | #121 | Exceptional 3.27 |
| Immigrants | Colombia | 92.8 /100 | #122 | Exceptional 3.27 |
| Alaskan Athabascans | 92.4 /100 | #123 | Exceptional 3.27 |
| South American Indians | 91.6 /100 | #124 | Exceptional 3.26 |
| Immigrants | Cuba | 91.3 /100 | #125 | Exceptional 3.26 |
| Immigrants | Costa Rica | 90.7 /100 | #126 | Exceptional 3.26 |
| Immigrants | Syria | 90.6 /100 | #127 | Exceptional 3.26 |
| Colombians | 89.9 /100 | #128 | Excellent 3.26 |
| Immigrants | Hong Kong | 88.6 /100 | #129 | Excellent 3.26 |
| Laotians | 88.5 /100 | #130 | Excellent 3.26 |
| Immigrants | Western Asia | 87.7 /100 | #131 | Excellent 3.26 |
| Costa Ricans | 86.8 /100 | #132 | Excellent 3.26 |
| Immigrants | Venezuela | 86.3 /100 | #133 | Excellent 3.26 |
| Africans | 84.9 /100 | #134 | Excellent 3.25 |
| Panamanians | 84.2 /100 | #135 | Excellent 3.25 |
| Comanche | 82.8 /100 | #136 | Excellent 3.25 |
| Immigrants | Middle Africa | 82.4 /100 | #137 | Excellent 3.25 |
| Cubans | 81.8 /100 | #138 | Excellent 3.25 |
| Immigrants | Ethiopia | 81.6 /100 | #139 | Excellent 3.25 |