Paiute vs Immigrants from Dominica Single Father Households
COMPARE
Paiute
Immigrants from Dominica
Single Father Households
Single Father Households Comparison
Paiute
Immigrants from Dominica
3.3%
SINGLE FATHER HOUSEHOLDS
0.0/ 100
METRIC RATING
336th/ 347
METRIC RANK
2.5%
SINGLE FATHER HOUSEHOLDS
4.8/ 100
METRIC RATING
240th/ 347
METRIC RANK
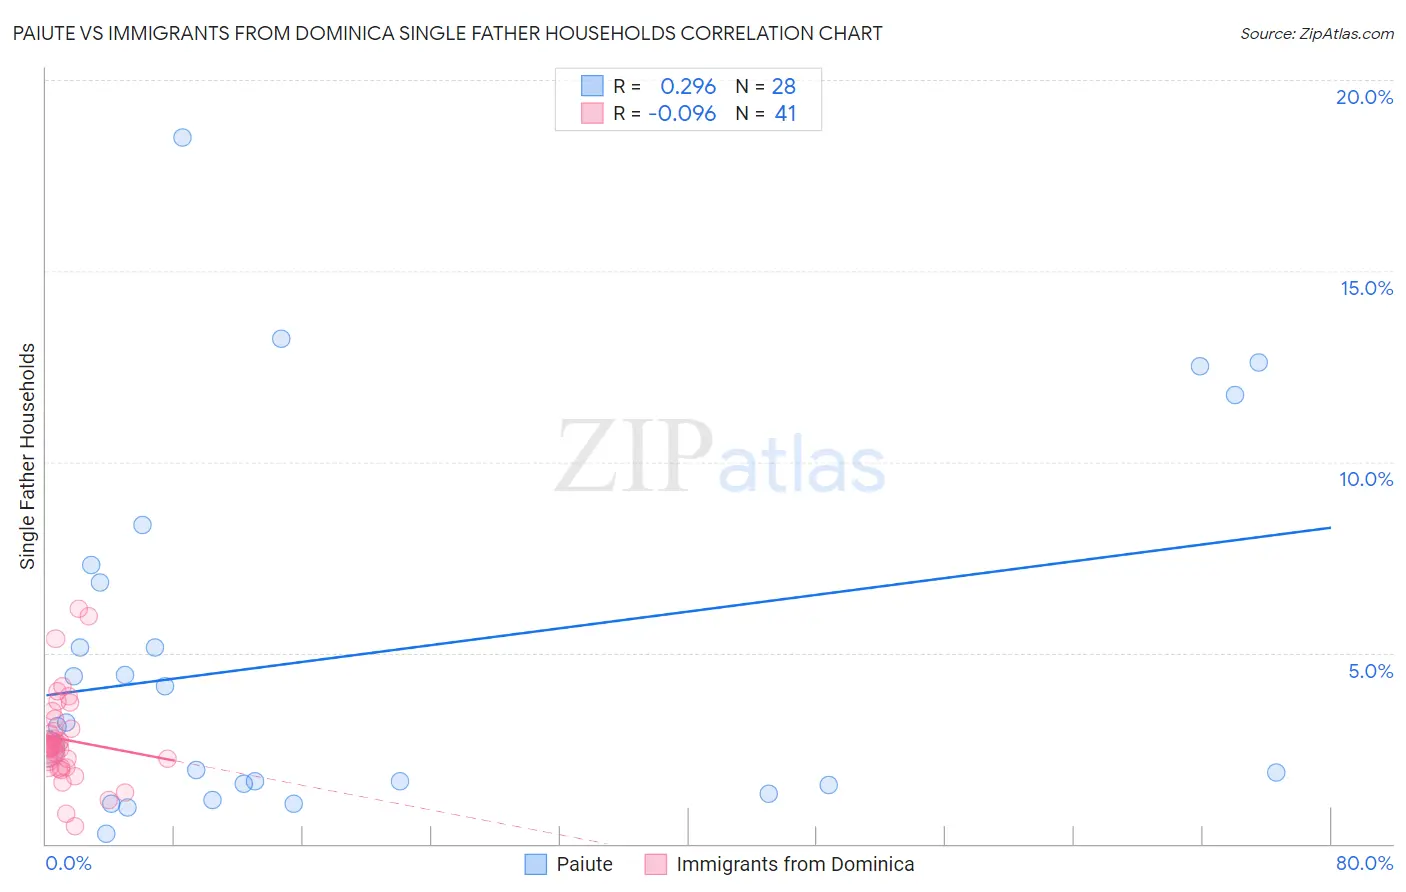
Paiute vs Immigrants from Dominica Single Father Households Correlation Chart
The statistical analysis conducted on geographies consisting of 58,300,881 people shows a weak positive correlation between the proportion of Paiute and percentage of single father households in the United States with a correlation coefficient (R) of 0.296 and weighted average of 3.3%. Similarly, the statistical analysis conducted on geographies consisting of 83,648,183 people shows a slight negative correlation between the proportion of Immigrants from Dominica and percentage of single father households in the United States with a correlation coefficient (R) of -0.096 and weighted average of 2.5%, a difference of 33.6%.
Single Father Households Correlation Summary
| Measurement | Paiute | Immigrants from Dominica |
| Minimum | 0.27% | 0.46% |
| Maximum | 18.5% | 6.1% |
| Range | 18.2% | 5.7% |
| Mean | 5.0% | 2.7% |
| Median | 3.1% | 2.5% |
| Interquartile 25% (IQ1) | 1.6% | 2.0% |
| Interquartile 75% (IQ3) | 7.1% | 3.1% |
| Interquartile Range (IQR) | 5.5% | 1.1% |
| Standard Deviation (Sample) | 4.7% | 1.2% |
| Standard Deviation (Population) | 4.7% | 1.2% |
Similar Demographics by Single Father Households
Demographics Similar to Paiute by Single Father Households
In terms of single father households, the demographic groups most similar to Paiute are Colville (3.3%, a difference of 0.030%), Yuman (3.3%, a difference of 0.050%), Pueblo (3.3%, a difference of 0.26%), Sioux (3.3%, a difference of 0.94%), and Alaskan Athabascan (3.4%, a difference of 2.4%).
| Demographics | Rating | Rank | Single Father Households |
| Chippewa | 0.0 /100 | #329 | Tragic 3.1% |
| Nepalese | 0.0 /100 | #330 | Tragic 3.1% |
| Navajo | 0.0 /100 | #331 | Tragic 3.2% |
| Yaqui | 0.0 /100 | #332 | Tragic 3.2% |
| Natives/Alaskans | 0.0 /100 | #333 | Tragic 3.2% |
| Yuman | 0.0 /100 | #334 | Tragic 3.3% |
| Colville | 0.0 /100 | #335 | Tragic 3.3% |
| Paiute | 0.0 /100 | #336 | Tragic 3.3% |
| Pueblo | 0.0 /100 | #337 | Tragic 3.3% |
| Sioux | 0.0 /100 | #338 | Tragic 3.3% |
| Alaskan Athabascans | 0.0 /100 | #339 | Tragic 3.4% |
| Alaska Natives | 0.0 /100 | #340 | Tragic 3.5% |
| Crow | 0.0 /100 | #341 | Tragic 3.5% |
| Tohono O'odham | 0.0 /100 | #342 | Tragic 3.8% |
| Pima | 0.0 /100 | #343 | Tragic 4.2% |
Demographics Similar to Immigrants from Dominica by Single Father Households
In terms of single father households, the demographic groups most similar to Immigrants from Dominica are Portuguese (2.5%, a difference of 0.26%), Osage (2.5%, a difference of 0.29%), Immigrants from Oceania (2.5%, a difference of 0.36%), Immigrants from Sierra Leone (2.5%, a difference of 0.37%), and Sierra Leonean (2.5%, a difference of 0.41%).
| Demographics | Rating | Rank | Single Father Households |
| Immigrants | Western Africa | 7.0 /100 | #233 | Tragic 2.4% |
| Africans | 6.3 /100 | #234 | Tragic 2.5% |
| Immigrants | Immigrants | 6.3 /100 | #235 | Tragic 2.5% |
| Cajuns | 6.1 /100 | #236 | Tragic 2.5% |
| Sierra Leoneans | 5.9 /100 | #237 | Tragic 2.5% |
| Immigrants | Sierra Leone | 5.8 /100 | #238 | Tragic 2.5% |
| Immigrants | Oceania | 5.8 /100 | #239 | Tragic 2.5% |
| Immigrants | Dominica | 4.8 /100 | #240 | Tragic 2.5% |
| Portuguese | 4.1 /100 | #241 | Tragic 2.5% |
| Osage | 4.1 /100 | #242 | Tragic 2.5% |
| Spaniards | 3.1 /100 | #243 | Tragic 2.5% |
| Immigrants | Middle Africa | 2.8 /100 | #244 | Tragic 2.5% |
| Basques | 2.5 /100 | #245 | Tragic 2.5% |
| Native Hawaiians | 2.5 /100 | #246 | Tragic 2.5% |
| Delaware | 2.5 /100 | #247 | Tragic 2.5% |