Subsaharan African vs Immigrants from Trinidad and Tobago 6th Grade
COMPARE
Subsaharan African
Immigrants from Trinidad and Tobago
6th Grade
6th Grade Comparison
Sub-Saharan Africans
Immigrants from Trinidad and Tobago
96.7%
6TH GRADE
3.5/ 100
METRIC RATING
231st/ 347
METRIC RANK
96.2%
6TH GRADE
0.0/ 100
METRIC RATING
287th/ 347
METRIC RANK
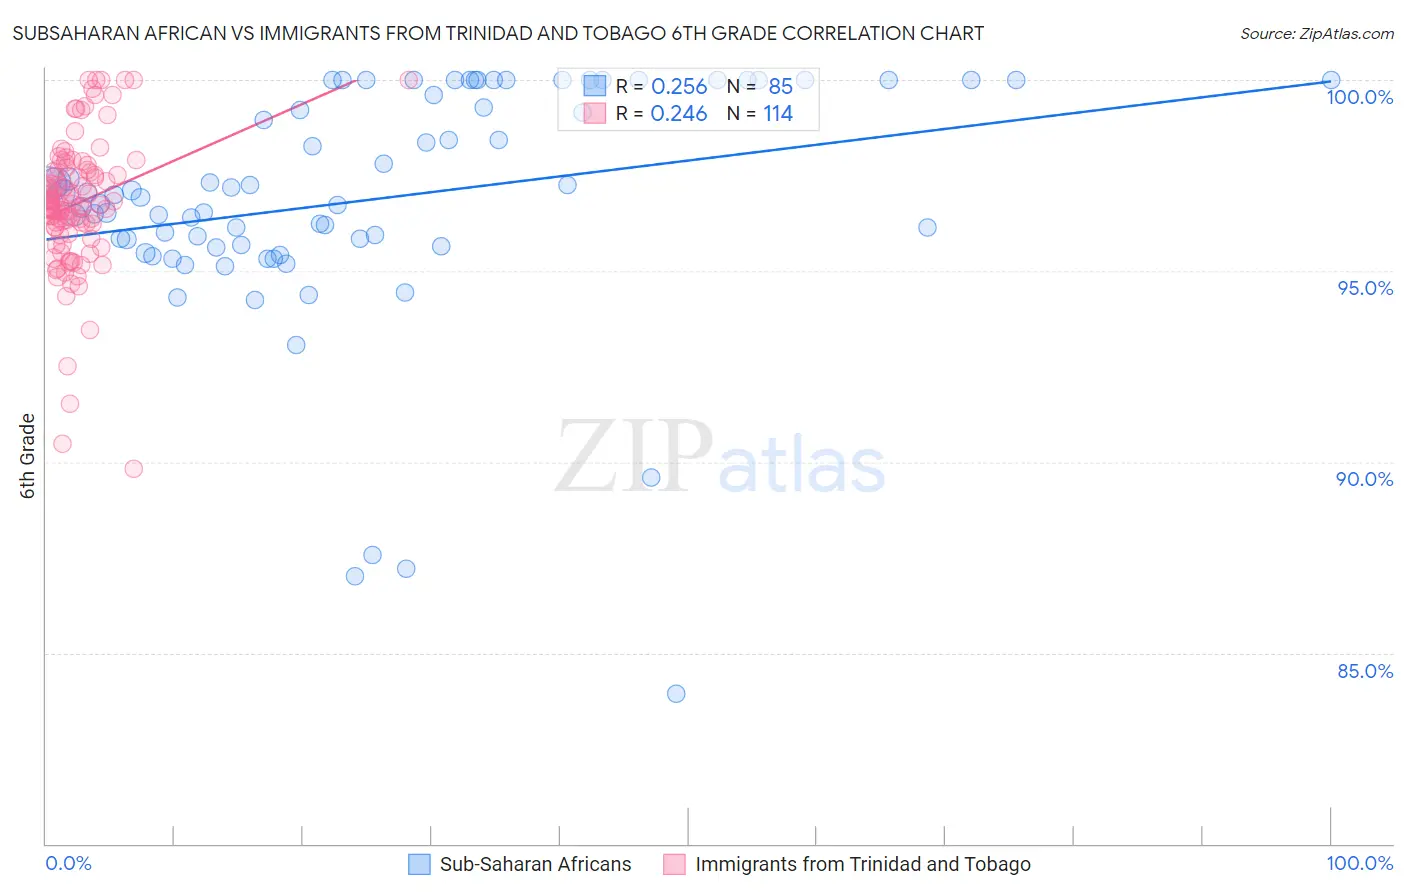
Subsaharan African vs Immigrants from Trinidad and Tobago 6th Grade Correlation Chart
The statistical analysis conducted on geographies consisting of 508,219,094 people shows a weak positive correlation between the proportion of Sub-Saharan Africans and percentage of population with at least 6th grade education in the United States with a correlation coefficient (R) of 0.256 and weighted average of 96.7%. Similarly, the statistical analysis conducted on geographies consisting of 223,526,834 people shows a weak positive correlation between the proportion of Immigrants from Trinidad and Tobago and percentage of population with at least 6th grade education in the United States with a correlation coefficient (R) of 0.246 and weighted average of 96.2%, a difference of 0.53%.
6th Grade Correlation Summary
| Measurement | Subsaharan African | Immigrants from Trinidad and Tobago |
| Minimum | 83.9% | 89.8% |
| Maximum | 100.0% | 100.0% |
| Range | 16.1% | 10.2% |
| Mean | 96.9% | 96.8% |
| Median | 97.0% | 96.7% |
| Interquartile 25% (IQ1) | 95.7% | 96.1% |
| Interquartile 75% (IQ3) | 100.0% | 97.6% |
| Interquartile Range (IQR) | 4.3% | 1.5% |
| Standard Deviation (Sample) | 3.1% | 1.8% |
| Standard Deviation (Population) | 3.1% | 1.8% |
Similar Demographics by 6th Grade
Demographics Similar to Sub-Saharan Africans by 6th Grade
In terms of 6th grade, the demographic groups most similar to Sub-Saharan Africans are South American Indian (96.7%, a difference of 0.0%), Immigrants from Eastern Asia (96.7%, a difference of 0.010%), Yuman (96.7%, a difference of 0.010%), Immigrants from Panama (96.7%, a difference of 0.020%), and Immigrants from Western Asia (96.7%, a difference of 0.020%).
| Demographics | Rating | Rank | 6th Grade |
| Immigrants | Southern Europe | 4.4 /100 | #224 | Tragic 96.7% |
| Immigrants | Pakistan | 4.4 /100 | #225 | Tragic 96.7% |
| Immigrants | Panama | 4.2 /100 | #226 | Tragic 96.7% |
| Immigrants | Western Asia | 4.1 /100 | #227 | Tragic 96.7% |
| Immigrants | Malaysia | 4.0 /100 | #228 | Tragic 96.7% |
| Assyrians/Chaldeans/Syriacs | 4.0 /100 | #229 | Tragic 96.7% |
| Immigrants | Eastern Asia | 4.0 /100 | #230 | Tragic 96.7% |
| Sub-Saharan Africans | 3.5 /100 | #231 | Tragic 96.7% |
| South American Indians | 3.5 /100 | #232 | Tragic 96.7% |
| Yuman | 3.2 /100 | #233 | Tragic 96.7% |
| Uruguayans | 2.5 /100 | #234 | Tragic 96.6% |
| Asians | 2.4 /100 | #235 | Tragic 96.6% |
| Immigrants | Indonesia | 2.3 /100 | #236 | Tragic 96.6% |
| Immigrants | Eastern Africa | 2.0 /100 | #237 | Tragic 96.6% |
| Nigerians | 1.9 /100 | #238 | Tragic 96.6% |
Demographics Similar to Immigrants from Trinidad and Tobago by 6th Grade
In terms of 6th grade, the demographic groups most similar to Immigrants from Trinidad and Tobago are Barbadian (96.2%, a difference of 0.010%), Malaysian (96.2%, a difference of 0.010%), Immigrants from Eritrea (96.1%, a difference of 0.030%), Somali (96.2%, a difference of 0.040%), and Fijian (96.2%, a difference of 0.050%).
| Demographics | Rating | Rank | 6th Grade |
| Immigrants | Afghanistan | 0.1 /100 | #280 | Tragic 96.2% |
| Trinidadians and Tobagonians | 0.1 /100 | #281 | Tragic 96.2% |
| Houma | 0.1 /100 | #282 | Tragic 96.2% |
| Cubans | 0.1 /100 | #283 | Tragic 96.2% |
| Fijians | 0.1 /100 | #284 | Tragic 96.2% |
| Somalis | 0.1 /100 | #285 | Tragic 96.2% |
| Barbadians | 0.0 /100 | #286 | Tragic 96.2% |
| Immigrants | Trinidad and Tobago | 0.0 /100 | #287 | Tragic 96.2% |
| Malaysians | 0.0 /100 | #288 | Tragic 96.2% |
| Immigrants | Eritrea | 0.0 /100 | #289 | Tragic 96.1% |
| Immigrants | Somalia | 0.0 /100 | #290 | Tragic 96.1% |
| Immigrants | St. Vincent and the Grenadines | 0.0 /100 | #291 | Tragic 96.1% |
| Immigrants | Barbados | 0.0 /100 | #292 | Tragic 96.1% |
| Immigrants | West Indies | 0.0 /100 | #293 | Tragic 96.1% |
| British West Indians | 0.0 /100 | #294 | Tragic 96.0% |