Luxembourger vs Immigrants from Trinidad and Tobago Single Mother Households
COMPARE
Luxembourger
Immigrants from Trinidad and Tobago
Single Mother Households
Single Mother Households Comparison
Luxembourgers
Immigrants from Trinidad and Tobago
5.6%
SINGLE MOTHER HOUSEHOLDS
98.7/ 100
METRIC RATING
59th/ 347
METRIC RANK
7.6%
SINGLE MOTHER HOUSEHOLDS
0.1/ 100
METRIC RATING
277th/ 347
METRIC RANK
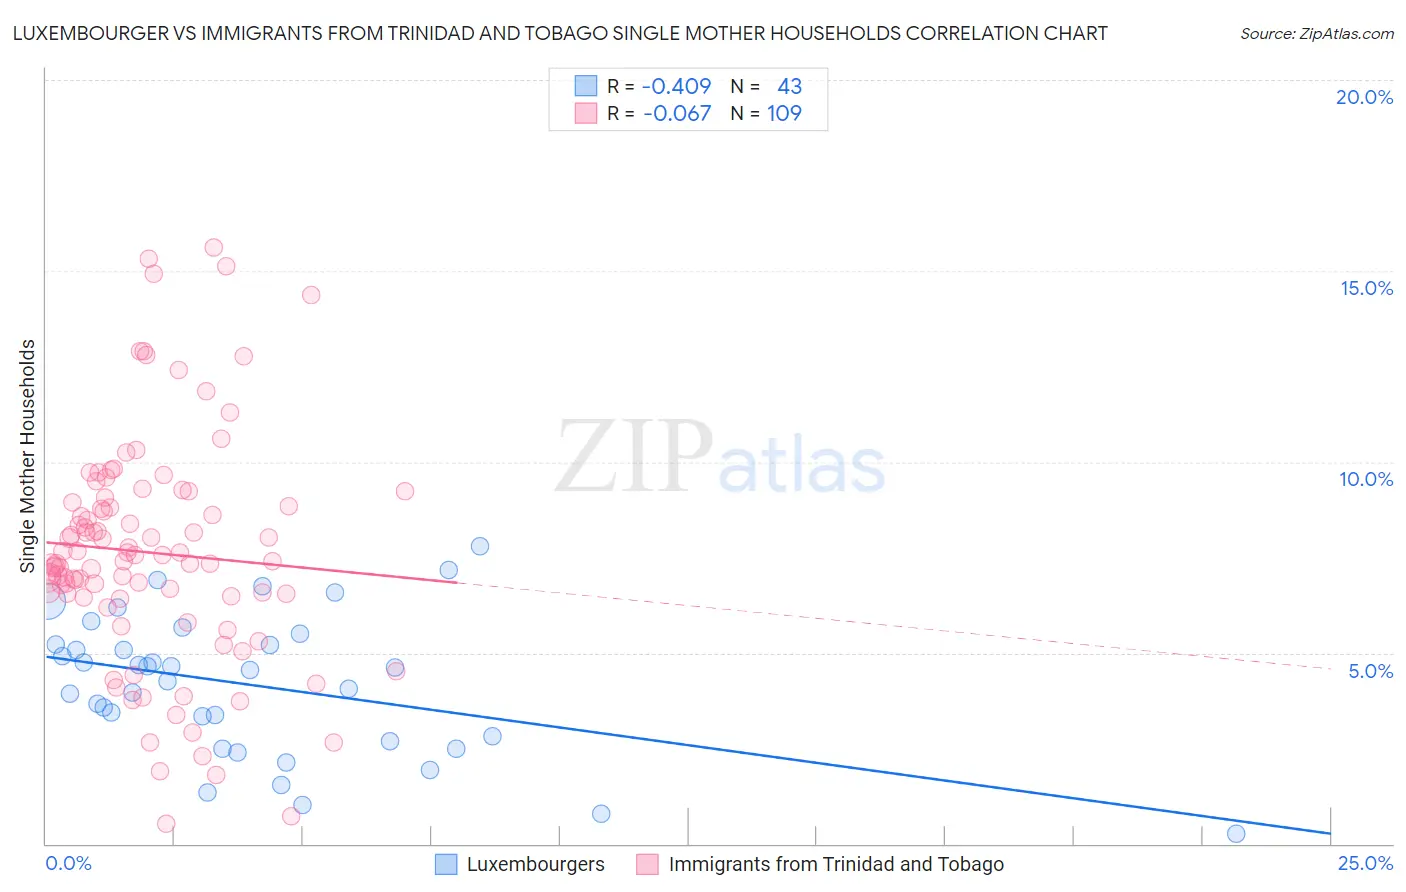
Luxembourger vs Immigrants from Trinidad and Tobago Single Mother Households Correlation Chart
The statistical analysis conducted on geographies consisting of 144,304,959 people shows a moderate negative correlation between the proportion of Luxembourgers and percentage of single mother households in the United States with a correlation coefficient (R) of -0.409 and weighted average of 5.6%. Similarly, the statistical analysis conducted on geographies consisting of 223,270,530 people shows a slight negative correlation between the proportion of Immigrants from Trinidad and Tobago and percentage of single mother households in the United States with a correlation coefficient (R) of -0.067 and weighted average of 7.6%, a difference of 36.8%.
Single Mother Households Correlation Summary
| Measurement | Luxembourger | Immigrants from Trinidad and Tobago |
| Minimum | 0.28% | 0.52% |
| Maximum | 7.8% | 15.6% |
| Range | 7.5% | 15.1% |
| Mean | 4.1% | 7.6% |
| Median | 4.6% | 7.4% |
| Interquartile 25% (IQ1) | 2.7% | 6.5% |
| Interquartile 75% (IQ3) | 5.2% | 9.0% |
| Interquartile Range (IQR) | 2.5% | 2.5% |
| Standard Deviation (Sample) | 1.8% | 3.0% |
| Standard Deviation (Population) | 1.8% | 3.0% |
Similar Demographics by Single Mother Households
Demographics Similar to Luxembourgers by Single Mother Households
In terms of single mother households, the demographic groups most similar to Luxembourgers are Immigrants from Norway (5.6%, a difference of 0.15%), Australian (5.6%, a difference of 0.22%), Polish (5.6%, a difference of 0.23%), Immigrants from North Macedonia (5.6%, a difference of 0.29%), and Immigrants from France (5.6%, a difference of 0.33%).
| Demographics | Rating | Rank | Single Mother Households |
| Swedes | 99.1 /100 | #52 | Exceptional 5.5% |
| Immigrants | Russia | 99.1 /100 | #53 | Exceptional 5.5% |
| Immigrants | Lebanon | 99.1 /100 | #54 | Exceptional 5.5% |
| Immigrants | Denmark | 99.1 /100 | #55 | Exceptional 5.5% |
| Immigrants | Romania | 99.0 /100 | #56 | Exceptional 5.5% |
| Immigrants | Europe | 99.0 /100 | #57 | Exceptional 5.5% |
| Danes | 98.9 /100 | #58 | Exceptional 5.5% |
| Luxembourgers | 98.7 /100 | #59 | Exceptional 5.6% |
| Immigrants | Norway | 98.7 /100 | #60 | Exceptional 5.6% |
| Australians | 98.7 /100 | #61 | Exceptional 5.6% |
| Poles | 98.6 /100 | #62 | Exceptional 5.6% |
| Immigrants | North Macedonia | 98.6 /100 | #63 | Exceptional 5.6% |
| Immigrants | France | 98.6 /100 | #64 | Exceptional 5.6% |
| Greeks | 98.6 /100 | #65 | Exceptional 5.6% |
| Immigrants | Canada | 98.5 /100 | #66 | Exceptional 5.6% |
Demographics Similar to Immigrants from Trinidad and Tobago by Single Mother Households
In terms of single mother households, the demographic groups most similar to Immigrants from Trinidad and Tobago are Central American (7.6%, a difference of 0.0%), Guyanese (7.6%, a difference of 0.040%), Immigrants from El Salvador (7.6%, a difference of 0.23%), Central American Indian (7.6%, a difference of 0.49%), and Immigrants from Guyana (7.6%, a difference of 0.59%).
| Demographics | Rating | Rank | Single Mother Households |
| Immigrants | Cuba | 0.1 /100 | #270 | Tragic 7.5% |
| Salvadorans | 0.1 /100 | #271 | Tragic 7.5% |
| Immigrants | Azores | 0.1 /100 | #272 | Tragic 7.5% |
| Belizeans | 0.1 /100 | #273 | Tragic 7.6% |
| Immigrants | Guyana | 0.1 /100 | #274 | Tragic 7.6% |
| Central American Indians | 0.1 /100 | #275 | Tragic 7.6% |
| Guyanese | 0.1 /100 | #276 | Tragic 7.6% |
| Immigrants | Trinidad and Tobago | 0.1 /100 | #277 | Tragic 7.6% |
| Central Americans | 0.1 /100 | #278 | Tragic 7.6% |
| Immigrants | El Salvador | 0.0 /100 | #279 | Tragic 7.6% |
| Immigrants | Sierra Leone | 0.0 /100 | #280 | Tragic 7.7% |
| Immigrants | Laos | 0.0 /100 | #281 | Tragic 7.7% |
| Guatemalans | 0.0 /100 | #282 | Tragic 7.7% |
| Nigerians | 0.0 /100 | #283 | Tragic 7.7% |
| Immigrants | Belize | 0.0 /100 | #284 | Tragic 7.7% |