Palestinian vs Brazilian Currently Married
COMPARE
Palestinian
Brazilian
Currently Married
Currently Married Comparison
Palestinians
Brazilians
47.6%
CURRENTLY MARRIED
90.4/ 100
METRIC RATING
116th/ 347
METRIC RANK
46.4%
CURRENTLY MARRIED
39.3/ 100
METRIC RATING
184th/ 347
METRIC RANK
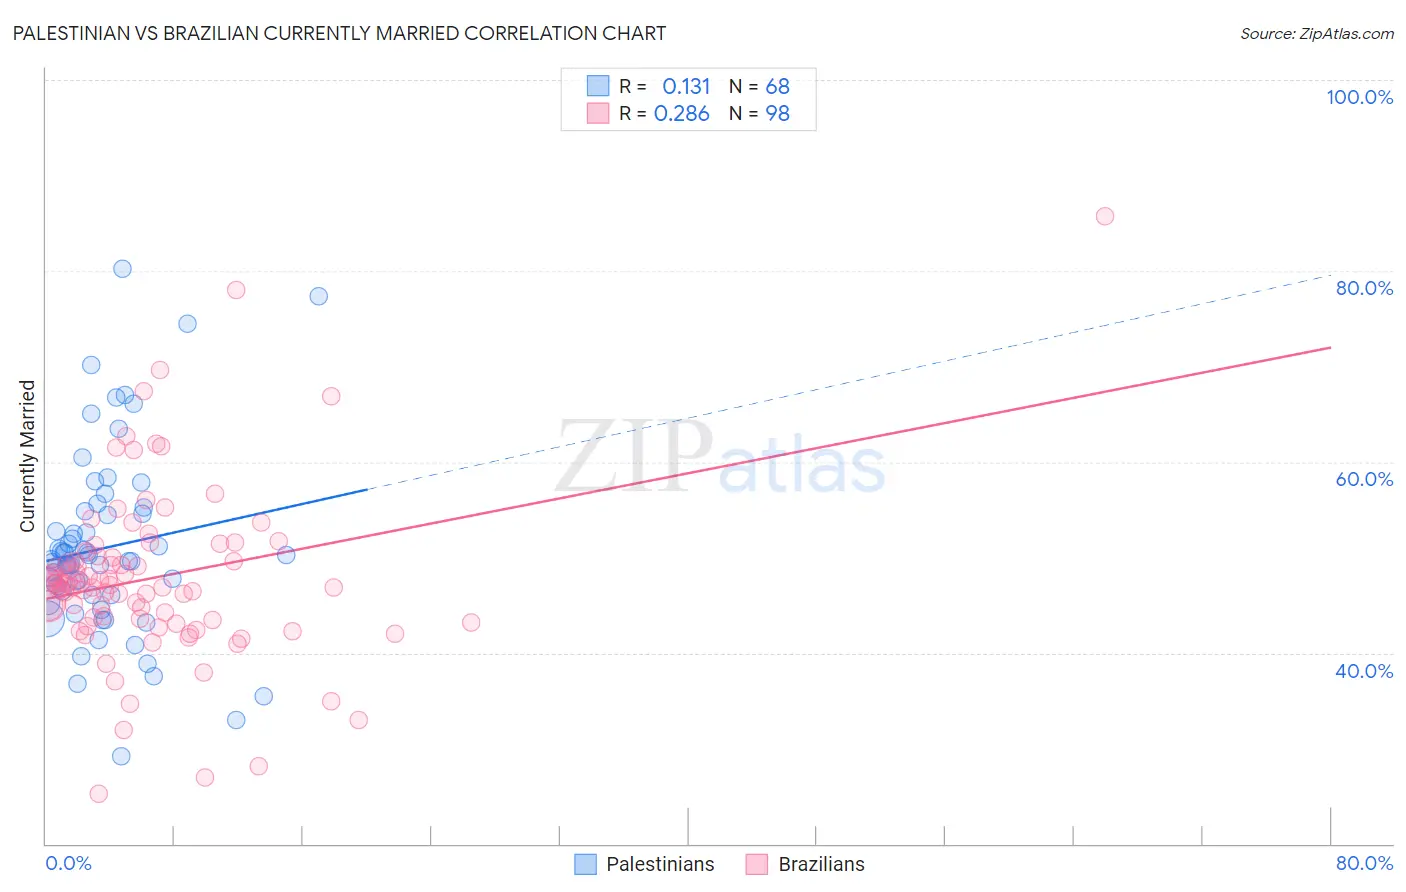
Palestinian vs Brazilian Currently Married Correlation Chart
The statistical analysis conducted on geographies consisting of 216,437,079 people shows a poor positive correlation between the proportion of Palestinians and percentage of population currently married in the United States with a correlation coefficient (R) of 0.131 and weighted average of 47.6%. Similarly, the statistical analysis conducted on geographies consisting of 323,904,544 people shows a weak positive correlation between the proportion of Brazilians and percentage of population currently married in the United States with a correlation coefficient (R) of 0.286 and weighted average of 46.4%, a difference of 2.5%.
Currently Married Correlation Summary
| Measurement | Palestinian | Brazilian |
| Minimum | 29.1% | 25.3% |
| Maximum | 80.2% | 85.7% |
| Range | 51.1% | 60.4% |
| Mean | 51.0% | 47.9% |
| Median | 49.7% | 47.2% |
| Interquartile 25% (IQ1) | 46.0% | 43.5% |
| Interquartile 75% (IQ3) | 54.7% | 50.1% |
| Interquartile Range (IQR) | 8.7% | 6.6% |
| Standard Deviation (Sample) | 9.7% | 9.1% |
| Standard Deviation (Population) | 9.7% | 9.1% |
Similar Demographics by Currently Married
Demographics Similar to Palestinians by Currently Married
In terms of currently married, the demographic groups most similar to Palestinians are South African (47.6%, a difference of 0.010%), Immigrants from Indonesia (47.6%, a difference of 0.010%), Puget Sound Salish (47.6%, a difference of 0.020%), Immigrants from Philippines (47.6%, a difference of 0.020%), and Australian (47.6%, a difference of 0.020%).
| Demographics | Rating | Rank | Currently Married |
| Immigrants | Egypt | 92.3 /100 | #109 | Exceptional 47.7% |
| Immigrants | Russia | 92.0 /100 | #110 | Exceptional 47.7% |
| Immigrants | Hungary | 91.2 /100 | #111 | Exceptional 47.6% |
| Immigrants | Western Europe | 91.1 /100 | #112 | Exceptional 47.6% |
| Immigrants | Denmark | 90.9 /100 | #113 | Exceptional 47.6% |
| South Africans | 90.5 /100 | #114 | Exceptional 47.6% |
| Immigrants | Indonesia | 90.5 /100 | #115 | Exceptional 47.6% |
| Palestinians | 90.4 /100 | #116 | Exceptional 47.6% |
| Puget Sound Salish | 90.3 /100 | #117 | Exceptional 47.6% |
| Immigrants | Philippines | 90.2 /100 | #118 | Exceptional 47.6% |
| Australians | 90.2 /100 | #119 | Exceptional 47.6% |
| Syrians | 88.9 /100 | #120 | Excellent 47.5% |
| Immigrants | Croatia | 88.6 /100 | #121 | Excellent 47.5% |
| Osage | 87.9 /100 | #122 | Excellent 47.5% |
| Immigrants | Kazakhstan | 87.2 /100 | #123 | Excellent 47.4% |
Demographics Similar to Brazilians by Currently Married
In terms of currently married, the demographic groups most similar to Brazilians are Immigrants from Northern Africa (46.5%, a difference of 0.020%), Mongolian (46.4%, a difference of 0.070%), Potawatomi (46.5%, a difference of 0.10%), Immigrants from Chile (46.4%, a difference of 0.10%), and Ottawa (46.5%, a difference of 0.14%).
| Demographics | Rating | Rank | Currently Married |
| Israelis | 48.6 /100 | #177 | Average 46.6% |
| Chickasaw | 47.8 /100 | #178 | Average 46.6% |
| Immigrants | Oceania | 44.6 /100 | #179 | Average 46.5% |
| Costa Ricans | 43.7 /100 | #180 | Average 46.5% |
| Ottawa | 43.0 /100 | #181 | Average 46.5% |
| Potawatomi | 41.9 /100 | #182 | Average 46.5% |
| Immigrants | Northern Africa | 39.7 /100 | #183 | Fair 46.5% |
| Brazilians | 39.3 /100 | #184 | Fair 46.4% |
| Mongolians | 37.6 /100 | #185 | Fair 46.4% |
| Immigrants | Chile | 36.8 /100 | #186 | Fair 46.4% |
| Immigrants | Peru | 35.3 /100 | #187 | Fair 46.4% |
| Colombians | 31.8 /100 | #188 | Fair 46.3% |
| Fijians | 30.3 /100 | #189 | Fair 46.3% |
| Choctaw | 29.1 /100 | #190 | Fair 46.3% |
| Immigrants | France | 27.7 /100 | #191 | Fair 46.2% |