Subsaharan African vs Pennsylvania German Currently Married
COMPARE
Subsaharan African
Pennsylvania German
Currently Married
Currently Married Comparison
Sub-Saharan Africans
Pennsylvania Germans
42.6%
CURRENTLY MARRIED
0.0/ 100
METRIC RATING
292nd/ 347
METRIC RANK
49.6%
CURRENTLY MARRIED
99.9/ 100
METRIC RATING
15th/ 347
METRIC RANK
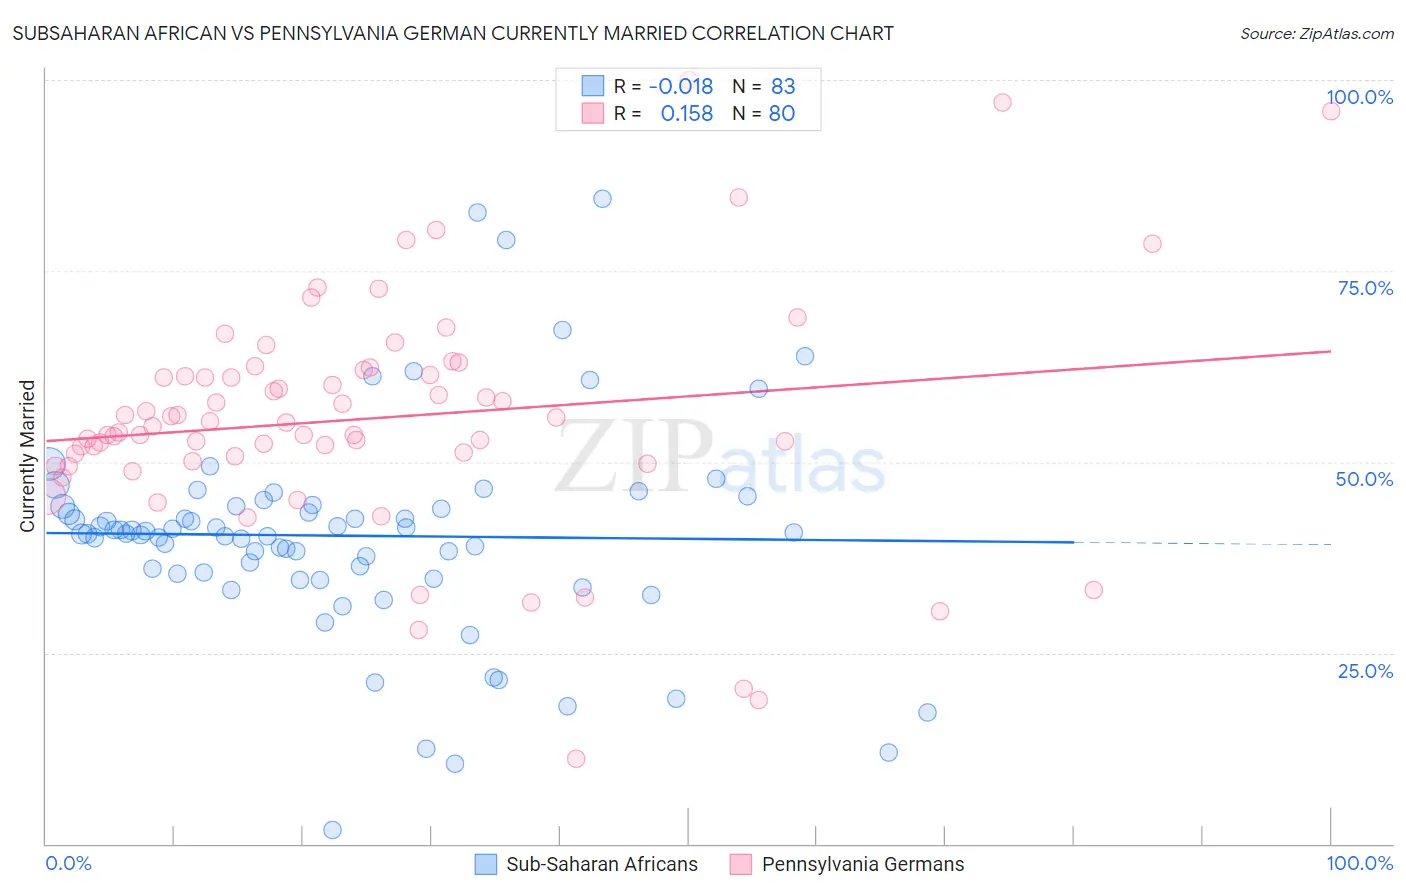
Subsaharan African vs Pennsylvania German Currently Married Correlation Chart
The statistical analysis conducted on geographies consisting of 508,112,533 people shows no correlation between the proportion of Sub-Saharan Africans and percentage of population currently married in the United States with a correlation coefficient (R) of -0.018 and weighted average of 42.6%. Similarly, the statistical analysis conducted on geographies consisting of 234,101,517 people shows a poor positive correlation between the proportion of Pennsylvania Germans and percentage of population currently married in the United States with a correlation coefficient (R) of 0.158 and weighted average of 49.6%, a difference of 16.4%.
Currently Married Correlation Summary
| Measurement | Subsaharan African | Pennsylvania German |
| Minimum | 1.8% | 11.1% |
| Maximum | 84.5% | 100.0% |
| Range | 82.7% | 88.9% |
| Mean | 40.3% | 55.7% |
| Median | 40.7% | 55.0% |
| Interquartile 25% (IQ1) | 35.4% | 50.4% |
| Interquartile 75% (IQ3) | 44.3% | 61.7% |
| Interquartile Range (IQR) | 8.9% | 11.3% |
| Standard Deviation (Sample) | 14.0% | 15.5% |
| Standard Deviation (Population) | 13.9% | 15.4% |
Similar Demographics by Currently Married
Demographics Similar to Sub-Saharan Africans by Currently Married
In terms of currently married, the demographic groups most similar to Sub-Saharan Africans are Yuman (42.6%, a difference of 0.020%), Honduran (42.5%, a difference of 0.14%), Immigrants from Guatemala (42.6%, a difference of 0.16%), Immigrants from Ghana (42.7%, a difference of 0.27%), and Paiute (42.7%, a difference of 0.28%).
| Demographics | Rating | Rank | Currently Married |
| Immigrants | Middle Africa | 0.0 /100 | #285 | Tragic 43.0% |
| Ghanaians | 0.0 /100 | #286 | Tragic 42.9% |
| Guatemalans | 0.0 /100 | #287 | Tragic 42.9% |
| Natives/Alaskans | 0.0 /100 | #288 | Tragic 42.8% |
| Paiute | 0.0 /100 | #289 | Tragic 42.7% |
| Immigrants | Ghana | 0.0 /100 | #290 | Tragic 42.7% |
| Immigrants | Guatemala | 0.0 /100 | #291 | Tragic 42.6% |
| Sub-Saharan Africans | 0.0 /100 | #292 | Tragic 42.6% |
| Yuman | 0.0 /100 | #293 | Tragic 42.6% |
| Hondurans | 0.0 /100 | #294 | Tragic 42.5% |
| Immigrants | Western Africa | 0.0 /100 | #295 | Tragic 42.4% |
| Menominee | 0.0 /100 | #296 | Tragic 42.3% |
| Cheyenne | 0.0 /100 | #297 | Tragic 42.2% |
| Immigrants | Honduras | 0.0 /100 | #298 | Tragic 42.2% |
| Liberians | 0.0 /100 | #299 | Tragic 42.2% |
Demographics Similar to Pennsylvania Germans by Currently Married
In terms of currently married, the demographic groups most similar to Pennsylvania Germans are German (49.6%, a difference of 0.030%), Dutch (49.6%, a difference of 0.040%), Chinese (49.5%, a difference of 0.14%), Scandinavian (49.5%, a difference of 0.16%), and English (49.7%, a difference of 0.30%).
| Demographics | Rating | Rank | Currently Married |
| Swedes | 100.0 /100 | #8 | Exceptional 50.0% |
| Czechs | 99.9 /100 | #9 | Exceptional 49.9% |
| Filipinos | 99.9 /100 | #10 | Exceptional 49.7% |
| English | 99.9 /100 | #11 | Exceptional 49.7% |
| Swiss | 99.9 /100 | #12 | Exceptional 49.7% |
| Dutch | 99.9 /100 | #13 | Exceptional 49.6% |
| Germans | 99.9 /100 | #14 | Exceptional 49.6% |
| Pennsylvania Germans | 99.9 /100 | #15 | Exceptional 49.6% |
| Chinese | 99.9 /100 | #16 | Exceptional 49.5% |
| Scandinavians | 99.9 /100 | #17 | Exceptional 49.5% |
| Immigrants | Scotland | 99.8 /100 | #18 | Exceptional 49.3% |
| Europeans | 99.8 /100 | #19 | Exceptional 49.3% |
| Luxembourgers | 99.8 /100 | #20 | Exceptional 49.3% |
| Scottish | 99.8 /100 | #21 | Exceptional 49.2% |
| Bulgarians | 99.7 /100 | #22 | Exceptional 49.1% |