Subsaharan African vs Immigrants from Cabo Verde Currently Married
COMPARE
Subsaharan African
Immigrants from Cabo Verde
Currently Married
Currently Married Comparison
Sub-Saharan Africans
Immigrants from Cabo Verde
42.6%
CURRENTLY MARRIED
0.0/ 100
METRIC RATING
292nd/ 347
METRIC RANK
37.8%
CURRENTLY MARRIED
0.0/ 100
METRIC RATING
344th/ 347
METRIC RANK
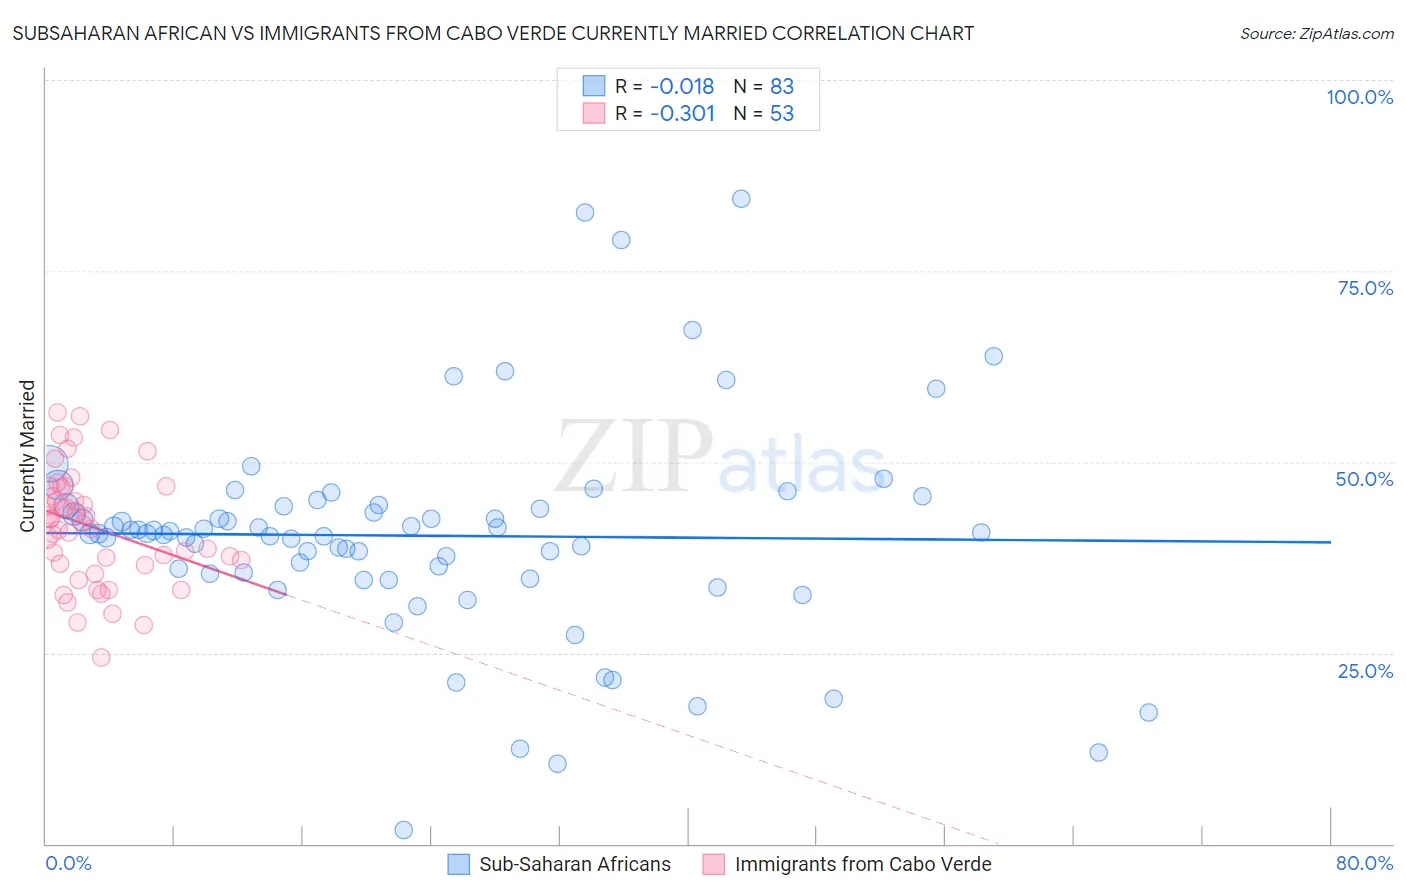
Subsaharan African vs Immigrants from Cabo Verde Currently Married Correlation Chart
The statistical analysis conducted on geographies consisting of 508,112,533 people shows no correlation between the proportion of Sub-Saharan Africans and percentage of population currently married in the United States with a correlation coefficient (R) of -0.018 and weighted average of 42.6%. Similarly, the statistical analysis conducted on geographies consisting of 38,158,666 people shows a mild negative correlation between the proportion of Immigrants from Cabo Verde and percentage of population currently married in the United States with a correlation coefficient (R) of -0.301 and weighted average of 37.8%, a difference of 12.5%.
Currently Married Correlation Summary
| Measurement | Subsaharan African | Immigrants from Cabo Verde |
| Minimum | 1.8% | 24.4% |
| Maximum | 84.5% | 56.5% |
| Range | 82.7% | 32.1% |
| Mean | 40.3% | 41.5% |
| Median | 40.7% | 41.9% |
| Interquartile 25% (IQ1) | 35.4% | 36.6% |
| Interquartile 75% (IQ3) | 44.3% | 46.7% |
| Interquartile Range (IQR) | 8.9% | 10.1% |
| Standard Deviation (Sample) | 14.0% | 7.4% |
| Standard Deviation (Population) | 13.9% | 7.3% |
Similar Demographics by Currently Married
Demographics Similar to Sub-Saharan Africans by Currently Married
In terms of currently married, the demographic groups most similar to Sub-Saharan Africans are Yuman (42.6%, a difference of 0.020%), Honduran (42.5%, a difference of 0.14%), Immigrants from Guatemala (42.6%, a difference of 0.16%), Immigrants from Ghana (42.7%, a difference of 0.27%), and Paiute (42.7%, a difference of 0.28%).
| Demographics | Rating | Rank | Currently Married |
| Immigrants | Middle Africa | 0.0 /100 | #285 | Tragic 43.0% |
| Ghanaians | 0.0 /100 | #286 | Tragic 42.9% |
| Guatemalans | 0.0 /100 | #287 | Tragic 42.9% |
| Natives/Alaskans | 0.0 /100 | #288 | Tragic 42.8% |
| Paiute | 0.0 /100 | #289 | Tragic 42.7% |
| Immigrants | Ghana | 0.0 /100 | #290 | Tragic 42.7% |
| Immigrants | Guatemala | 0.0 /100 | #291 | Tragic 42.6% |
| Sub-Saharan Africans | 0.0 /100 | #292 | Tragic 42.6% |
| Yuman | 0.0 /100 | #293 | Tragic 42.6% |
| Hondurans | 0.0 /100 | #294 | Tragic 42.5% |
| Immigrants | Western Africa | 0.0 /100 | #295 | Tragic 42.4% |
| Menominee | 0.0 /100 | #296 | Tragic 42.3% |
| Cheyenne | 0.0 /100 | #297 | Tragic 42.2% |
| Immigrants | Honduras | 0.0 /100 | #298 | Tragic 42.2% |
| Liberians | 0.0 /100 | #299 | Tragic 42.2% |
Demographics Similar to Immigrants from Cabo Verde by Currently Married
In terms of currently married, the demographic groups most similar to Immigrants from Cabo Verde are Pueblo (38.2%, a difference of 1.1%), Tohono O'odham (36.8%, a difference of 2.9%), Immigrants from Dominican Republic (38.9%, a difference of 2.9%), Navajo (39.0%, a difference of 3.1%), and Immigrants from Grenada (39.1%, a difference of 3.5%).
| Demographics | Rating | Rank | Currently Married |
| Yup'ik | 0.0 /100 | #333 | Tragic 39.9% |
| Puerto Ricans | 0.0 /100 | #334 | Tragic 39.9% |
| Lumbee | 0.0 /100 | #335 | Tragic 39.8% |
| British West Indians | 0.0 /100 | #336 | Tragic 39.8% |
| Blacks/African Americans | 0.0 /100 | #337 | Tragic 39.6% |
| Cape Verdeans | 0.0 /100 | #338 | Tragic 39.6% |
| Dominicans | 0.0 /100 | #339 | Tragic 39.5% |
| Immigrants | Grenada | 0.0 /100 | #340 | Tragic 39.1% |
| Navajo | 0.0 /100 | #341 | Tragic 39.0% |
| Immigrants | Dominican Republic | 0.0 /100 | #342 | Tragic 38.9% |
| Pueblo | 0.0 /100 | #343 | Tragic 38.2% |
| Immigrants | Cabo Verde | 0.0 /100 | #344 | Tragic 37.8% |
| Tohono O'odham | 0.0 /100 | #345 | Tragic 36.8% |
| Hopi | 0.0 /100 | #346 | Tragic 36.5% |
| Pima | 0.0 /100 | #347 | Tragic 35.9% |