Immigrants from Croatia vs Swedish Divorced or Separated
COMPARE
Immigrants from Croatia
Swedish
Divorced or Separated
Divorced or Separated Comparison
Immigrants from Croatia
Swedes
11.6%
DIVORCED OR SEPARATED
98.3/ 100
METRIC RATING
102nd/ 347
METRIC RANK
12.1%
DIVORCED OR SEPARATED
34.4/ 100
METRIC RATING
191st/ 347
METRIC RANK
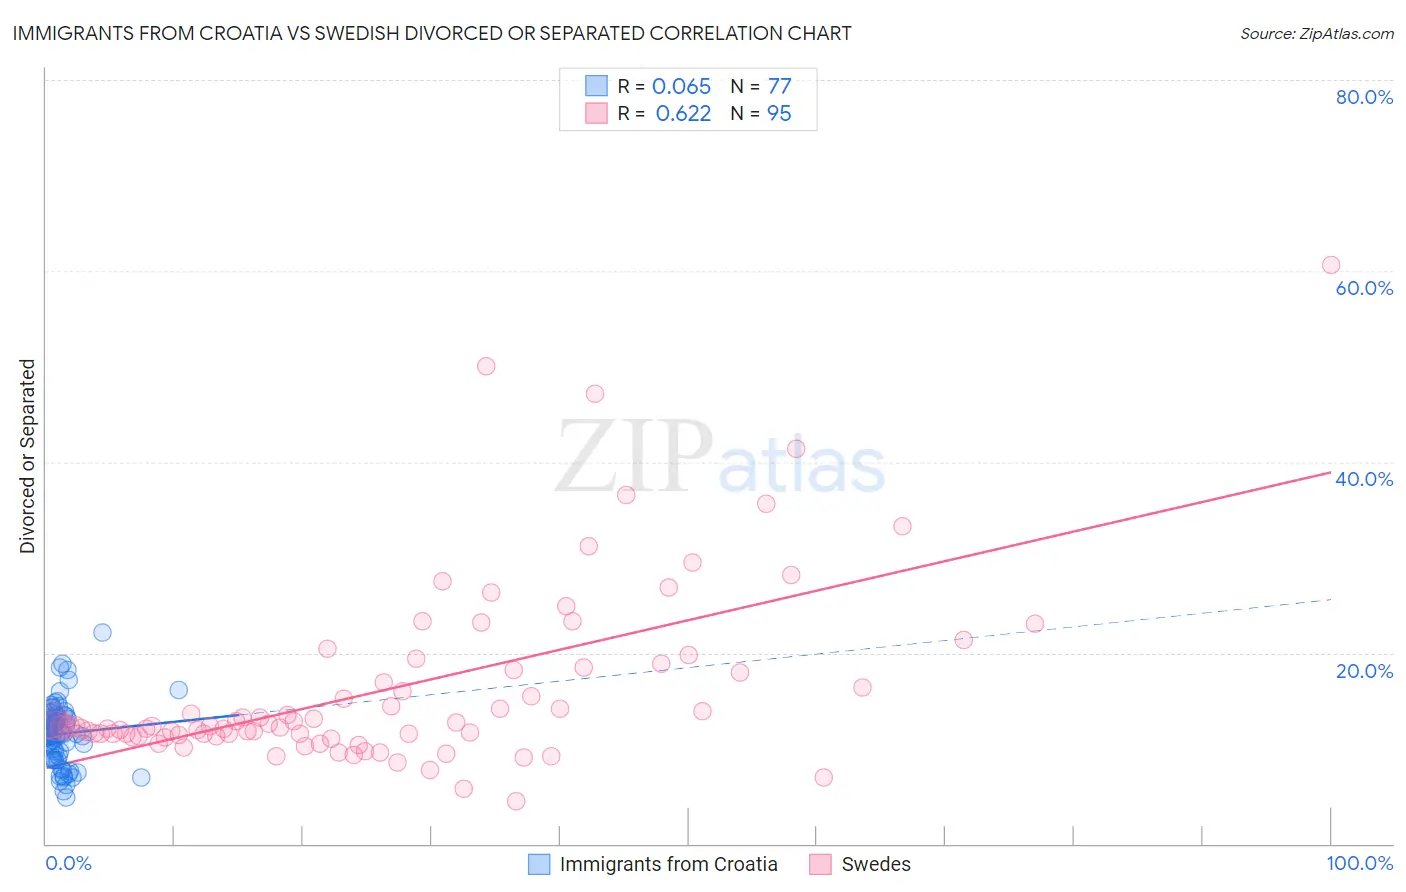
Immigrants from Croatia vs Swedish Divorced or Separated Correlation Chart
The statistical analysis conducted on geographies consisting of 132,566,764 people shows a slight positive correlation between the proportion of Immigrants from Croatia and percentage of population currently divorced or separated in the United States with a correlation coefficient (R) of 0.065 and weighted average of 11.6%. Similarly, the statistical analysis conducted on geographies consisting of 538,888,854 people shows a significant positive correlation between the proportion of Swedes and percentage of population currently divorced or separated in the United States with a correlation coefficient (R) of 0.622 and weighted average of 12.1%, a difference of 4.2%.
Divorced or Separated Correlation Summary
| Measurement | Immigrants from Croatia | Swedish |
| Minimum | 4.8% | 4.5% |
| Maximum | 22.1% | 60.6% |
| Range | 17.3% | 56.1% |
| Mean | 11.5% | 16.3% |
| Median | 11.5% | 12.3% |
| Interquartile 25% (IQ1) | 9.1% | 11.4% |
| Interquartile 75% (IQ3) | 13.3% | 18.5% |
| Interquartile Range (IQR) | 4.1% | 7.2% |
| Standard Deviation (Sample) | 3.3% | 9.7% |
| Standard Deviation (Population) | 3.2% | 9.6% |
Similar Demographics by Divorced or Separated
Demographics Similar to Immigrants from Croatia by Divorced or Separated
In terms of divorced or separated, the demographic groups most similar to Immigrants from Croatia are Maltese (11.6%, a difference of 0.040%), Salvadoran (11.6%, a difference of 0.050%), Immigrants from Guyana (11.6%, a difference of 0.14%), Immigrants from Northern Europe (11.6%, a difference of 0.17%), and Immigrants from El Salvador (11.7%, a difference of 0.18%).
| Demographics | Rating | Rank | Divorced or Separated |
| Immigrants | Serbia | 98.8 /100 | #95 | Exceptional 11.6% |
| Immigrants | Ukraine | 98.7 /100 | #96 | Exceptional 11.6% |
| Latvians | 98.7 /100 | #97 | Exceptional 11.6% |
| Immigrants | Jordan | 98.6 /100 | #98 | Exceptional 11.6% |
| Immigrants | Sweden | 98.6 /100 | #99 | Exceptional 11.6% |
| Immigrants | Northern Europe | 98.6 /100 | #100 | Exceptional 11.6% |
| Immigrants | Guyana | 98.5 /100 | #101 | Exceptional 11.6% |
| Immigrants | Croatia | 98.3 /100 | #102 | Exceptional 11.6% |
| Maltese | 98.2 /100 | #103 | Exceptional 11.6% |
| Salvadorans | 98.2 /100 | #104 | Exceptional 11.6% |
| Immigrants | El Salvador | 97.9 /100 | #105 | Exceptional 11.7% |
| Immigrants | Kazakhstan | 97.8 /100 | #106 | Exceptional 11.7% |
| Native Hawaiians | 97.2 /100 | #107 | Exceptional 11.7% |
| Greeks | 96.9 /100 | #108 | Exceptional 11.7% |
| Immigrants | South Africa | 96.9 /100 | #109 | Exceptional 11.7% |
Demographics Similar to Swedes by Divorced or Separated
In terms of divorced or separated, the demographic groups most similar to Swedes are Moroccan (12.1%, a difference of 0.020%), Sierra Leonean (12.1%, a difference of 0.040%), Norwegian (12.1%, a difference of 0.050%), Immigrants from Thailand (12.1%, a difference of 0.070%), and Immigrants from Eritrea (12.1%, a difference of 0.10%).
| Demographics | Rating | Rank | Divorced or Separated |
| Immigrants | North America | 41.1 /100 | #184 | Average 12.1% |
| Immigrants | Nigeria | 40.5 /100 | #185 | Average 12.1% |
| Immigrants | Chile | 39.0 /100 | #186 | Fair 12.1% |
| Belizeans | 37.7 /100 | #187 | Fair 12.1% |
| Immigrants | Belize | 37.6 /100 | #188 | Fair 12.1% |
| Sierra Leoneans | 35.5 /100 | #189 | Fair 12.1% |
| Moroccans | 34.8 /100 | #190 | Fair 12.1% |
| Swedes | 34.4 /100 | #191 | Fair 12.1% |
| Norwegians | 33.2 /100 | #192 | Fair 12.1% |
| Immigrants | Thailand | 32.5 /100 | #193 | Fair 12.1% |
| Immigrants | Eritrea | 31.9 /100 | #194 | Fair 12.1% |
| Immigrants | England | 31.4 /100 | #195 | Fair 12.1% |
| Immigrants | Burma/Myanmar | 30.4 /100 | #196 | Fair 12.1% |
| Immigrants | Africa | 30.3 /100 | #197 | Fair 12.1% |
| Nigerians | 30.1 /100 | #198 | Fair 12.1% |