Spanish vs Mexican Births to Unmarried Women
COMPARE
Spanish
Mexican
Births to Unmarried Women
Births to Unmarried Women Comparison
Spanish
Mexicans
34.1%
BIRTHS TO UNMARRIED WOMEN
4.0/ 100
METRIC RATING
225th/ 347
METRIC RANK
36.9%
BIRTHS TO UNMARRIED WOMEN
0.1/ 100
METRIC RATING
273rd/ 347
METRIC RANK
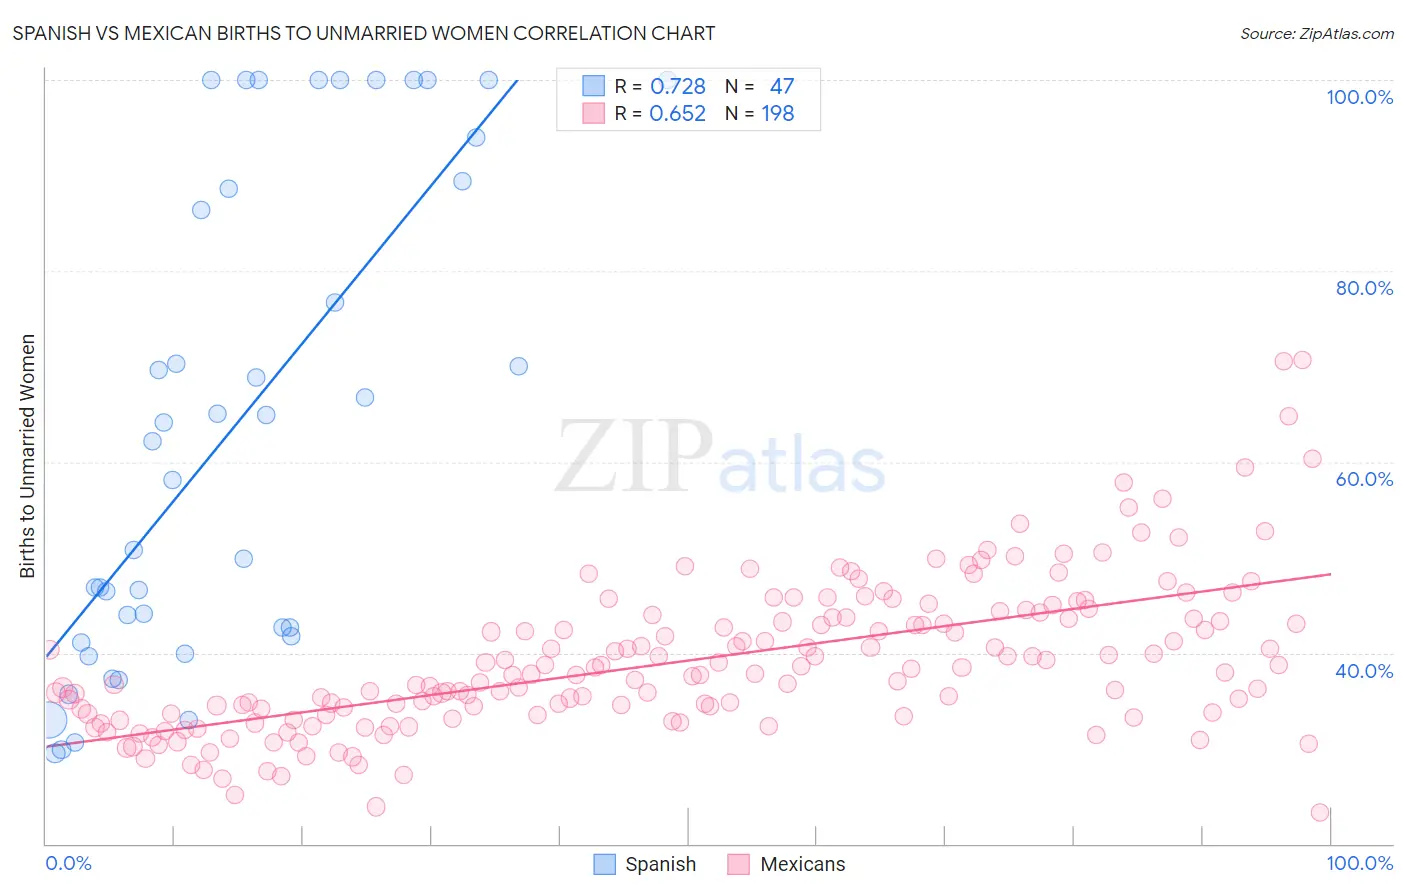
Spanish vs Mexican Births to Unmarried Women Correlation Chart
The statistical analysis conducted on geographies consisting of 393,000,764 people shows a strong positive correlation between the proportion of Spanish and percentage of births to unmarried women in the United States with a correlation coefficient (R) of 0.728 and weighted average of 34.1%. Similarly, the statistical analysis conducted on geographies consisting of 505,082,784 people shows a significant positive correlation between the proportion of Mexicans and percentage of births to unmarried women in the United States with a correlation coefficient (R) of 0.652 and weighted average of 36.9%, a difference of 8.4%.
Births to Unmarried Women Correlation Summary
| Measurement | Spanish | Mexican |
| Minimum | 29.5% | 23.3% |
| Maximum | 100.0% | 70.7% |
| Range | 70.5% | 47.4% |
| Mean | 63.5% | 39.1% |
| Median | 62.2% | 37.7% |
| Interquartile 25% (IQ1) | 41.7% | 33.5% |
| Interquartile 75% (IQ3) | 89.4% | 43.6% |
| Interquartile Range (IQR) | 47.7% | 10.1% |
| Standard Deviation (Sample) | 25.1% | 8.0% |
| Standard Deviation (Population) | 24.9% | 7.9% |
Similar Demographics by Births to Unmarried Women
Demographics Similar to Spanish by Births to Unmarried Women
In terms of births to unmarried women, the demographic groups most similar to Spanish are Immigrants from Laos (34.0%, a difference of 0.16%), Pennsylvania German (34.0%, a difference of 0.17%), Delaware (34.2%, a difference of 0.39%), Immigrants from Panama (34.2%, a difference of 0.41%), and Panamanian (34.2%, a difference of 0.44%).
| Demographics | Rating | Rank | Births to Unmarried Women |
| Immigrants | Ecuador | 5.9 /100 | #218 | Tragic 33.7% |
| Alsatians | 5.4 /100 | #219 | Tragic 33.8% |
| Portuguese | 5.4 /100 | #220 | Tragic 33.8% |
| Malaysians | 5.0 /100 | #221 | Tragic 33.9% |
| Immigrants | Uruguay | 4.8 /100 | #222 | Tragic 33.9% |
| Pennsylvania Germans | 4.3 /100 | #223 | Tragic 34.0% |
| Immigrants | Laos | 4.3 /100 | #224 | Tragic 34.0% |
| Spanish | 4.0 /100 | #225 | Tragic 34.1% |
| Delaware | 3.3 /100 | #226 | Tragic 34.2% |
| Immigrants | Panama | 3.3 /100 | #227 | Tragic 34.2% |
| Panamanians | 3.3 /100 | #228 | Tragic 34.2% |
| Immigrants | Sierra Leone | 3.1 /100 | #229 | Tragic 34.2% |
| Ghanaians | 3.1 /100 | #230 | Tragic 34.3% |
| Native Hawaiians | 2.9 /100 | #231 | Tragic 34.3% |
| French Canadians | 2.5 /100 | #232 | Tragic 34.4% |
Demographics Similar to Mexicans by Births to Unmarried Women
In terms of births to unmarried women, the demographic groups most similar to Mexicans are Cree (37.0%, a difference of 0.090%), Choctaw (36.9%, a difference of 0.12%), Barbadian (37.0%, a difference of 0.12%), Belizean (37.0%, a difference of 0.31%), and Immigrants from Barbados (36.8%, a difference of 0.33%).
| Demographics | Rating | Rank | Births to Unmarried Women |
| Immigrants | Senegal | 0.1 /100 | #266 | Tragic 36.7% |
| Central Americans | 0.1 /100 | #267 | Tragic 36.7% |
| Comanche | 0.1 /100 | #268 | Tragic 36.7% |
| Senegalese | 0.1 /100 | #269 | Tragic 36.8% |
| Immigrants | Congo | 0.1 /100 | #270 | Tragic 36.8% |
| Immigrants | Barbados | 0.1 /100 | #271 | Tragic 36.8% |
| Choctaw | 0.1 /100 | #272 | Tragic 36.9% |
| Mexicans | 0.1 /100 | #273 | Tragic 36.9% |
| Cree | 0.1 /100 | #274 | Tragic 37.0% |
| Barbadians | 0.1 /100 | #275 | Tragic 37.0% |
| Belizeans | 0.1 /100 | #276 | Tragic 37.0% |
| Guatemalans | 0.1 /100 | #277 | Tragic 37.1% |
| Immigrants | Latin America | 0.1 /100 | #278 | Tragic 37.1% |
| West Indians | 0.1 /100 | #279 | Tragic 37.3% |
| Immigrants | St. Vincent and the Grenadines | 0.1 /100 | #280 | Tragic 37.3% |