Norwegian vs Mexican Births to Unmarried Women
COMPARE
Norwegian
Mexican
Births to Unmarried Women
Births to Unmarried Women Comparison
Norwegians
Mexicans
29.3%
BIRTHS TO UNMARRIED WOMEN
95.8/ 100
METRIC RATING
96th/ 347
METRIC RANK
36.9%
BIRTHS TO UNMARRIED WOMEN
0.1/ 100
METRIC RATING
273rd/ 347
METRIC RANK
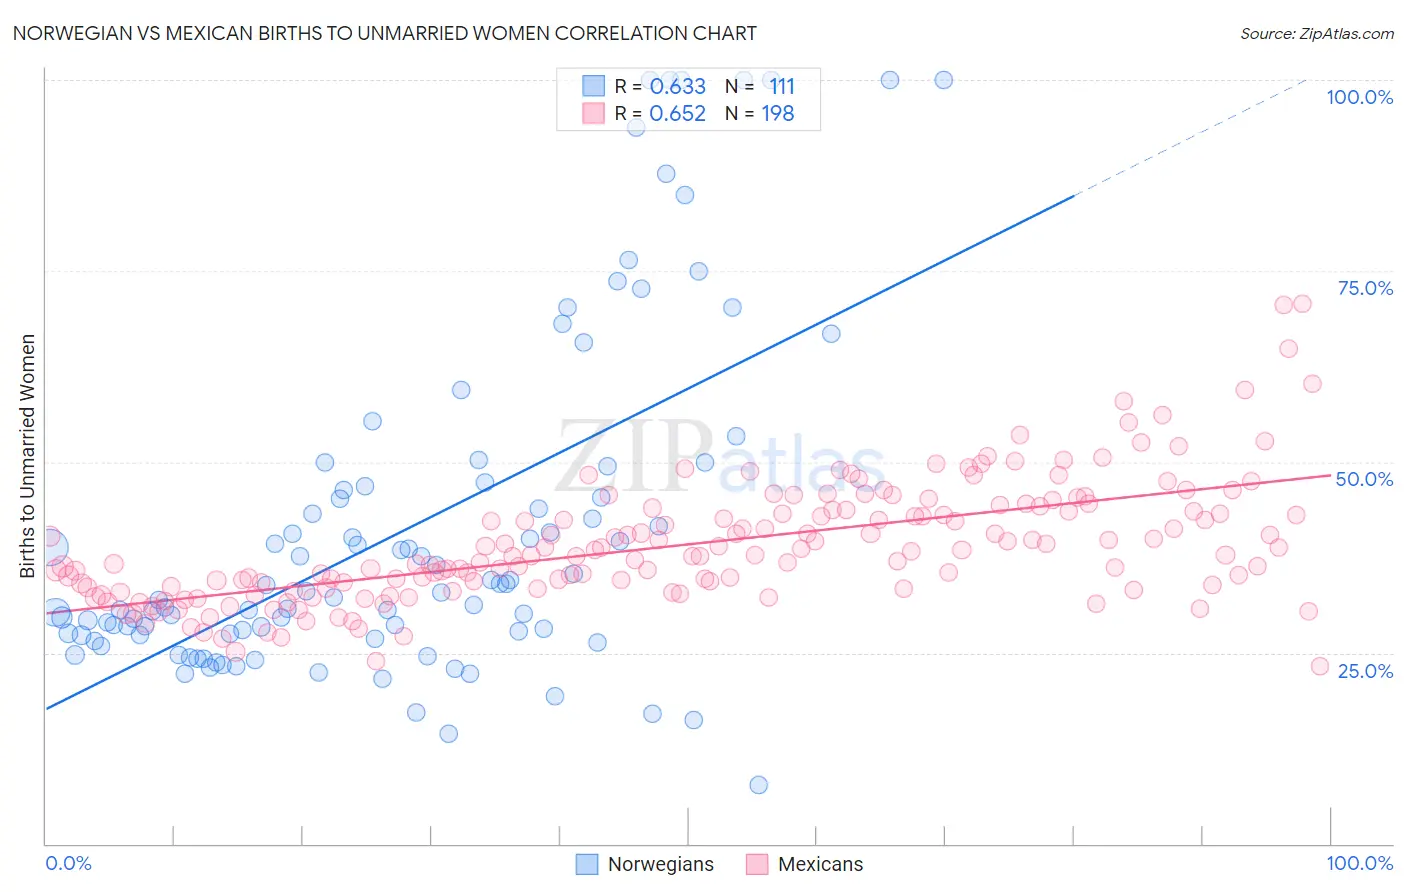
Norwegian vs Mexican Births to Unmarried Women Correlation Chart
The statistical analysis conducted on geographies consisting of 477,355,885 people shows a significant positive correlation between the proportion of Norwegians and percentage of births to unmarried women in the United States with a correlation coefficient (R) of 0.633 and weighted average of 29.3%. Similarly, the statistical analysis conducted on geographies consisting of 505,082,784 people shows a significant positive correlation between the proportion of Mexicans and percentage of births to unmarried women in the United States with a correlation coefficient (R) of 0.652 and weighted average of 36.9%, a difference of 25.9%.
Births to Unmarried Women Correlation Summary
| Measurement | Norwegian | Mexican |
| Minimum | 7.7% | 23.3% |
| Maximum | 100.0% | 70.7% |
| Range | 92.3% | 47.4% |
| Mean | 41.3% | 39.1% |
| Median | 32.9% | 37.7% |
| Interquartile 25% (IQ1) | 27.3% | 33.5% |
| Interquartile 75% (IQ3) | 46.7% | 43.6% |
| Interquartile Range (IQR) | 19.4% | 10.1% |
| Standard Deviation (Sample) | 22.3% | 8.0% |
| Standard Deviation (Population) | 22.2% | 7.9% |
Similar Demographics by Births to Unmarried Women
Demographics Similar to Norwegians by Births to Unmarried Women
In terms of births to unmarried women, the demographic groups most similar to Norwegians are Immigrants from South Africa (29.3%, a difference of 0.040%), Immigrants from Syria (29.4%, a difference of 0.070%), Immigrants from Vietnam (29.3%, a difference of 0.23%), Immigrants from Denmark (29.4%, a difference of 0.30%), and Luxembourger (29.4%, a difference of 0.30%).
| Demographics | Rating | Rank | Births to Unmarried Women |
| Immigrants | Saudi Arabia | 97.0 /100 | #89 | Exceptional 29.1% |
| Immigrants | Latvia | 96.8 /100 | #90 | Exceptional 29.1% |
| Immigrants | Fiji | 96.6 /100 | #91 | Exceptional 29.2% |
| Arabs | 96.5 /100 | #92 | Exceptional 29.2% |
| Estonians | 96.5 /100 | #93 | Exceptional 29.2% |
| Ukrainians | 96.3 /100 | #94 | Exceptional 29.2% |
| Immigrants | Vietnam | 96.1 /100 | #95 | Exceptional 29.3% |
| Norwegians | 95.8 /100 | #96 | Exceptional 29.3% |
| Immigrants | South Africa | 95.7 /100 | #97 | Exceptional 29.3% |
| Immigrants | Syria | 95.7 /100 | #98 | Exceptional 29.4% |
| Immigrants | Denmark | 95.3 /100 | #99 | Exceptional 29.4% |
| Luxembourgers | 95.2 /100 | #100 | Exceptional 29.4% |
| Immigrants | Northern Africa | 94.7 /100 | #101 | Exceptional 29.5% |
| Australians | 94.6 /100 | #102 | Exceptional 29.5% |
| Lebanese | 94.4 /100 | #103 | Exceptional 29.5% |
Demographics Similar to Mexicans by Births to Unmarried Women
In terms of births to unmarried women, the demographic groups most similar to Mexicans are Cree (37.0%, a difference of 0.090%), Choctaw (36.9%, a difference of 0.12%), Barbadian (37.0%, a difference of 0.12%), Belizean (37.0%, a difference of 0.31%), and Immigrants from Barbados (36.8%, a difference of 0.33%).
| Demographics | Rating | Rank | Births to Unmarried Women |
| Immigrants | Senegal | 0.1 /100 | #266 | Tragic 36.7% |
| Central Americans | 0.1 /100 | #267 | Tragic 36.7% |
| Comanche | 0.1 /100 | #268 | Tragic 36.7% |
| Senegalese | 0.1 /100 | #269 | Tragic 36.8% |
| Immigrants | Congo | 0.1 /100 | #270 | Tragic 36.8% |
| Immigrants | Barbados | 0.1 /100 | #271 | Tragic 36.8% |
| Choctaw | 0.1 /100 | #272 | Tragic 36.9% |
| Mexicans | 0.1 /100 | #273 | Tragic 36.9% |
| Cree | 0.1 /100 | #274 | Tragic 37.0% |
| Barbadians | 0.1 /100 | #275 | Tragic 37.0% |
| Belizeans | 0.1 /100 | #276 | Tragic 37.0% |
| Guatemalans | 0.1 /100 | #277 | Tragic 37.1% |
| Immigrants | Latin America | 0.1 /100 | #278 | Tragic 37.1% |
| West Indians | 0.1 /100 | #279 | Tragic 37.3% |
| Immigrants | St. Vincent and the Grenadines | 0.1 /100 | #280 | Tragic 37.3% |