Immigrants from Kuwait vs Mexican Births to Unmarried Women
COMPARE
Immigrants from Kuwait
Mexican
Births to Unmarried Women
Births to Unmarried Women Comparison
Immigrants from Kuwait
Mexicans
28.8%
BIRTHS TO UNMARRIED WOMEN
98.0/ 100
METRIC RATING
83rd/ 347
METRIC RANK
36.9%
BIRTHS TO UNMARRIED WOMEN
0.1/ 100
METRIC RATING
273rd/ 347
METRIC RANK
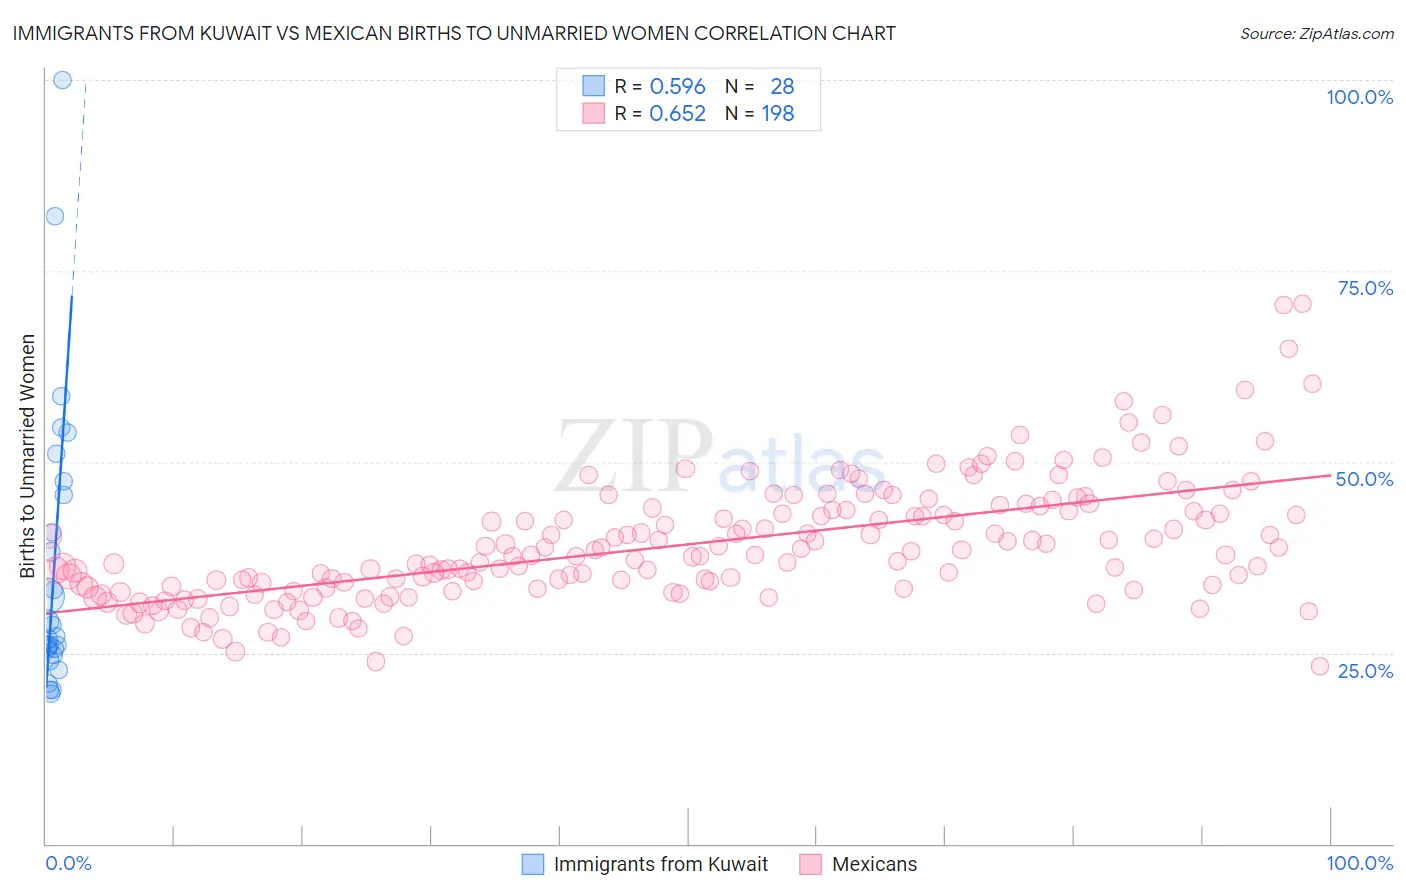
Immigrants from Kuwait vs Mexican Births to Unmarried Women Correlation Chart
The statistical analysis conducted on geographies consisting of 132,321,257 people shows a substantial positive correlation between the proportion of Immigrants from Kuwait and percentage of births to unmarried women in the United States with a correlation coefficient (R) of 0.596 and weighted average of 28.8%. Similarly, the statistical analysis conducted on geographies consisting of 505,082,784 people shows a significant positive correlation between the proportion of Mexicans and percentage of births to unmarried women in the United States with a correlation coefficient (R) of 0.652 and weighted average of 36.9%, a difference of 28.3%.
Births to Unmarried Women Correlation Summary
| Measurement | Immigrants from Kuwait | Mexican |
| Minimum | 19.6% | 23.3% |
| Maximum | 100.0% | 70.7% |
| Range | 80.4% | 47.4% |
| Mean | 36.8% | 39.1% |
| Median | 27.9% | 37.7% |
| Interquartile 25% (IQ1) | 25.1% | 33.5% |
| Interquartile 75% (IQ3) | 46.5% | 43.6% |
| Interquartile Range (IQR) | 21.4% | 10.1% |
| Standard Deviation (Sample) | 19.3% | 8.0% |
| Standard Deviation (Population) | 19.0% | 7.9% |
Similar Demographics by Births to Unmarried Women
Demographics Similar to Immigrants from Kuwait by Births to Unmarried Women
In terms of births to unmarried women, the demographic groups most similar to Immigrants from Kuwait are Romanian (28.7%, a difference of 0.080%), Immigrants from Austria (28.7%, a difference of 0.18%), Immigrants from Afghanistan (28.7%, a difference of 0.23%), Danish (28.7%, a difference of 0.25%), and Zimbabwean (28.7%, a difference of 0.27%).
| Demographics | Rating | Rank | Births to Unmarried Women |
| Israelis | 98.4 /100 | #76 | Exceptional 28.6% |
| Immigrants | Northern Europe | 98.3 /100 | #77 | Exceptional 28.6% |
| Zimbabweans | 98.2 /100 | #78 | Exceptional 28.7% |
| Danes | 98.2 /100 | #79 | Exceptional 28.7% |
| Immigrants | Afghanistan | 98.1 /100 | #80 | Exceptional 28.7% |
| Immigrants | Austria | 98.1 /100 | #81 | Exceptional 28.7% |
| Romanians | 98.0 /100 | #82 | Exceptional 28.7% |
| Immigrants | Kuwait | 98.0 /100 | #83 | Exceptional 28.8% |
| Immigrants | Poland | 97.6 /100 | #84 | Exceptional 28.9% |
| Sri Lankans | 97.5 /100 | #85 | Exceptional 28.9% |
| Immigrants | Jordan | 97.4 /100 | #86 | Exceptional 29.0% |
| Taiwanese | 97.3 /100 | #87 | Exceptional 29.0% |
| Immigrants | France | 97.3 /100 | #88 | Exceptional 29.0% |
| Immigrants | Saudi Arabia | 97.0 /100 | #89 | Exceptional 29.1% |
| Immigrants | Latvia | 96.8 /100 | #90 | Exceptional 29.1% |
Demographics Similar to Mexicans by Births to Unmarried Women
In terms of births to unmarried women, the demographic groups most similar to Mexicans are Cree (37.0%, a difference of 0.090%), Choctaw (36.9%, a difference of 0.12%), Barbadian (37.0%, a difference of 0.12%), Belizean (37.0%, a difference of 0.31%), and Immigrants from Barbados (36.8%, a difference of 0.33%).
| Demographics | Rating | Rank | Births to Unmarried Women |
| Immigrants | Senegal | 0.1 /100 | #266 | Tragic 36.7% |
| Central Americans | 0.1 /100 | #267 | Tragic 36.7% |
| Comanche | 0.1 /100 | #268 | Tragic 36.7% |
| Senegalese | 0.1 /100 | #269 | Tragic 36.8% |
| Immigrants | Congo | 0.1 /100 | #270 | Tragic 36.8% |
| Immigrants | Barbados | 0.1 /100 | #271 | Tragic 36.8% |
| Choctaw | 0.1 /100 | #272 | Tragic 36.9% |
| Mexicans | 0.1 /100 | #273 | Tragic 36.9% |
| Cree | 0.1 /100 | #274 | Tragic 37.0% |
| Barbadians | 0.1 /100 | #275 | Tragic 37.0% |
| Belizeans | 0.1 /100 | #276 | Tragic 37.0% |
| Guatemalans | 0.1 /100 | #277 | Tragic 37.1% |
| Immigrants | Latin America | 0.1 /100 | #278 | Tragic 37.1% |
| West Indians | 0.1 /100 | #279 | Tragic 37.3% |
| Immigrants | St. Vincent and the Grenadines | 0.1 /100 | #280 | Tragic 37.3% |