Spanish vs Immigrants from Dominican Republic Births to Unmarried Women
COMPARE
Spanish
Immigrants from Dominican Republic
Births to Unmarried Women
Births to Unmarried Women Comparison
Spanish
Immigrants from Dominican Republic
34.1%
BIRTHS TO UNMARRIED WOMEN
4.0/ 100
METRIC RATING
225th/ 347
METRIC RANK
40.1%
BIRTHS TO UNMARRIED WOMEN
0.0/ 100
METRIC RATING
317th/ 347
METRIC RANK
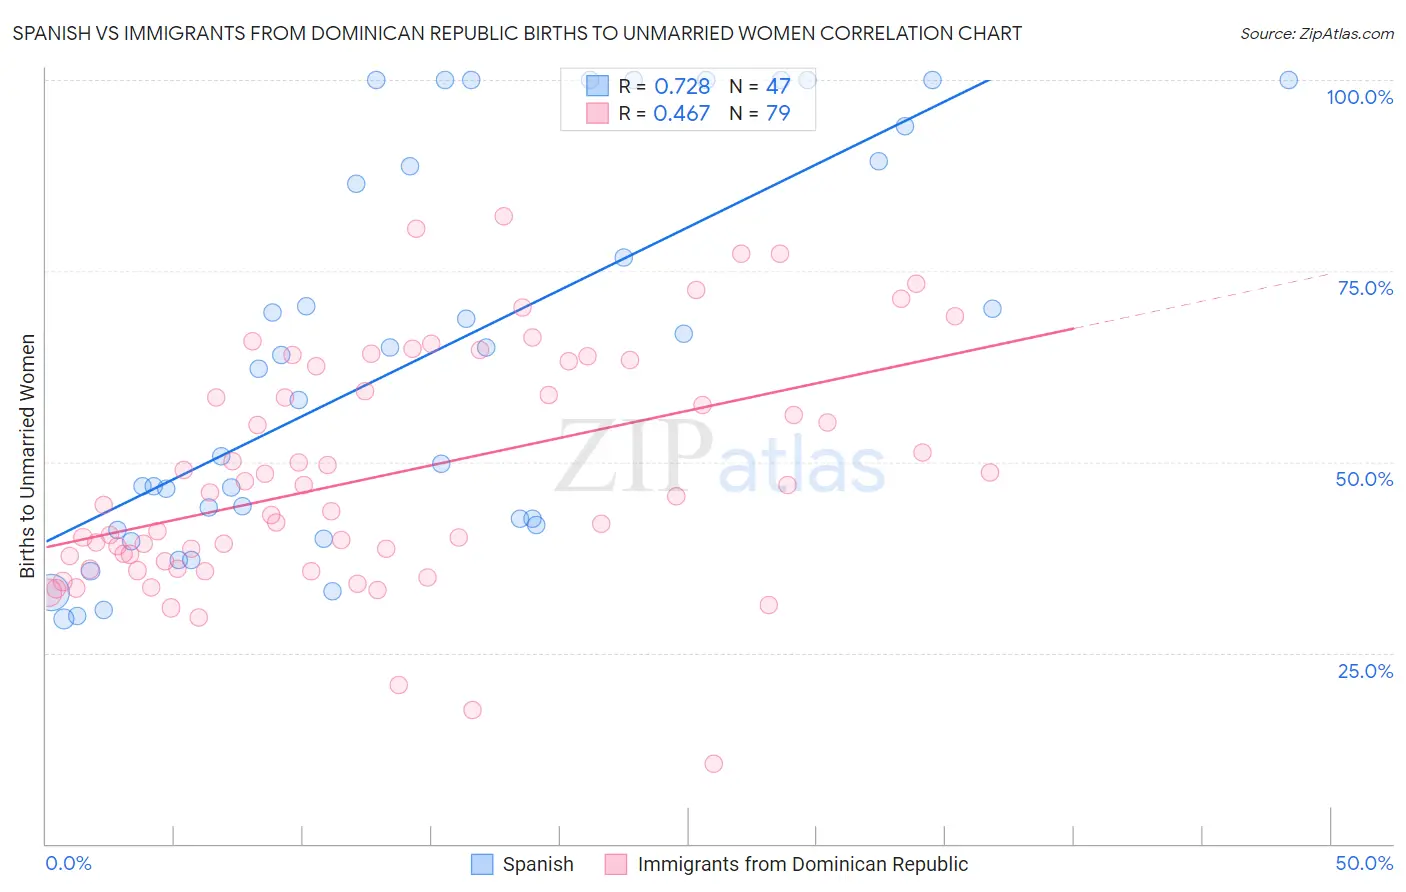
Spanish vs Immigrants from Dominican Republic Births to Unmarried Women Correlation Chart
The statistical analysis conducted on geographies consisting of 393,000,764 people shows a strong positive correlation between the proportion of Spanish and percentage of births to unmarried women in the United States with a correlation coefficient (R) of 0.728 and weighted average of 34.1%. Similarly, the statistical analysis conducted on geographies consisting of 261,488,729 people shows a moderate positive correlation between the proportion of Immigrants from Dominican Republic and percentage of births to unmarried women in the United States with a correlation coefficient (R) of 0.467 and weighted average of 40.1%, a difference of 17.7%.
Births to Unmarried Women Correlation Summary
| Measurement | Spanish | Immigrants from Dominican Republic |
| Minimum | 29.5% | 10.4% |
| Maximum | 100.0% | 82.1% |
| Range | 70.5% | 71.7% |
| Mean | 63.5% | 48.2% |
| Median | 62.2% | 45.6% |
| Interquartile 25% (IQ1) | 41.7% | 37.1% |
| Interquartile 75% (IQ3) | 89.4% | 62.5% |
| Interquartile Range (IQR) | 47.7% | 25.4% |
| Standard Deviation (Sample) | 25.1% | 15.2% |
| Standard Deviation (Population) | 24.9% | 15.1% |
Similar Demographics by Births to Unmarried Women
Demographics Similar to Spanish by Births to Unmarried Women
In terms of births to unmarried women, the demographic groups most similar to Spanish are Immigrants from Laos (34.0%, a difference of 0.16%), Pennsylvania German (34.0%, a difference of 0.17%), Delaware (34.2%, a difference of 0.39%), Immigrants from Panama (34.2%, a difference of 0.41%), and Panamanian (34.2%, a difference of 0.44%).
| Demographics | Rating | Rank | Births to Unmarried Women |
| Immigrants | Ecuador | 5.9 /100 | #218 | Tragic 33.7% |
| Alsatians | 5.4 /100 | #219 | Tragic 33.8% |
| Portuguese | 5.4 /100 | #220 | Tragic 33.8% |
| Malaysians | 5.0 /100 | #221 | Tragic 33.9% |
| Immigrants | Uruguay | 4.8 /100 | #222 | Tragic 33.9% |
| Pennsylvania Germans | 4.3 /100 | #223 | Tragic 34.0% |
| Immigrants | Laos | 4.3 /100 | #224 | Tragic 34.0% |
| Spanish | 4.0 /100 | #225 | Tragic 34.1% |
| Delaware | 3.3 /100 | #226 | Tragic 34.2% |
| Immigrants | Panama | 3.3 /100 | #227 | Tragic 34.2% |
| Panamanians | 3.3 /100 | #228 | Tragic 34.2% |
| Immigrants | Sierra Leone | 3.1 /100 | #229 | Tragic 34.2% |
| Ghanaians | 3.1 /100 | #230 | Tragic 34.3% |
| Native Hawaiians | 2.9 /100 | #231 | Tragic 34.3% |
| French Canadians | 2.5 /100 | #232 | Tragic 34.4% |
Demographics Similar to Immigrants from Dominican Republic by Births to Unmarried Women
In terms of births to unmarried women, the demographic groups most similar to Immigrants from Dominican Republic are Immigrants from Bahamas (40.1%, a difference of 0.070%), Apache (39.9%, a difference of 0.55%), Dominican (39.8%, a difference of 0.61%), Yakama (40.3%, a difference of 0.62%), and Immigrants from Caribbean (39.8%, a difference of 0.65%).
| Demographics | Rating | Rank | Births to Unmarried Women |
| Immigrants | Dominica | 0.0 /100 | #310 | Tragic 39.5% |
| Immigrants | Azores | 0.0 /100 | #311 | Tragic 39.6% |
| U.S. Virgin Islanders | 0.0 /100 | #312 | Tragic 39.6% |
| Africans | 0.0 /100 | #313 | Tragic 39.7% |
| Immigrants | Caribbean | 0.0 /100 | #314 | Tragic 39.8% |
| Dominicans | 0.0 /100 | #315 | Tragic 39.8% |
| Apache | 0.0 /100 | #316 | Tragic 39.9% |
| Immigrants | Dominican Republic | 0.0 /100 | #317 | Tragic 40.1% |
| Immigrants | Bahamas | 0.0 /100 | #318 | Tragic 40.1% |
| Yakama | 0.0 /100 | #319 | Tragic 40.3% |
| Crow | 0.0 /100 | #320 | Tragic 40.4% |
| Bahamians | 0.0 /100 | #321 | Tragic 40.8% |
| Cajuns | 0.0 /100 | #322 | Tragic 41.0% |
| Sioux | 0.0 /100 | #323 | Tragic 41.0% |
| Cape Verdeans | 0.0 /100 | #324 | Tragic 41.3% |