Spanish vs Immigrants from Bangladesh Births to Unmarried Women
COMPARE
Spanish
Immigrants from Bangladesh
Births to Unmarried Women
Births to Unmarried Women Comparison
Spanish
Immigrants from Bangladesh
34.1%
BIRTHS TO UNMARRIED WOMEN
4.0/ 100
METRIC RATING
225th/ 347
METRIC RANK
30.9%
BIRTHS TO UNMARRIED WOMEN
73.9/ 100
METRIC RATING
155th/ 347
METRIC RANK
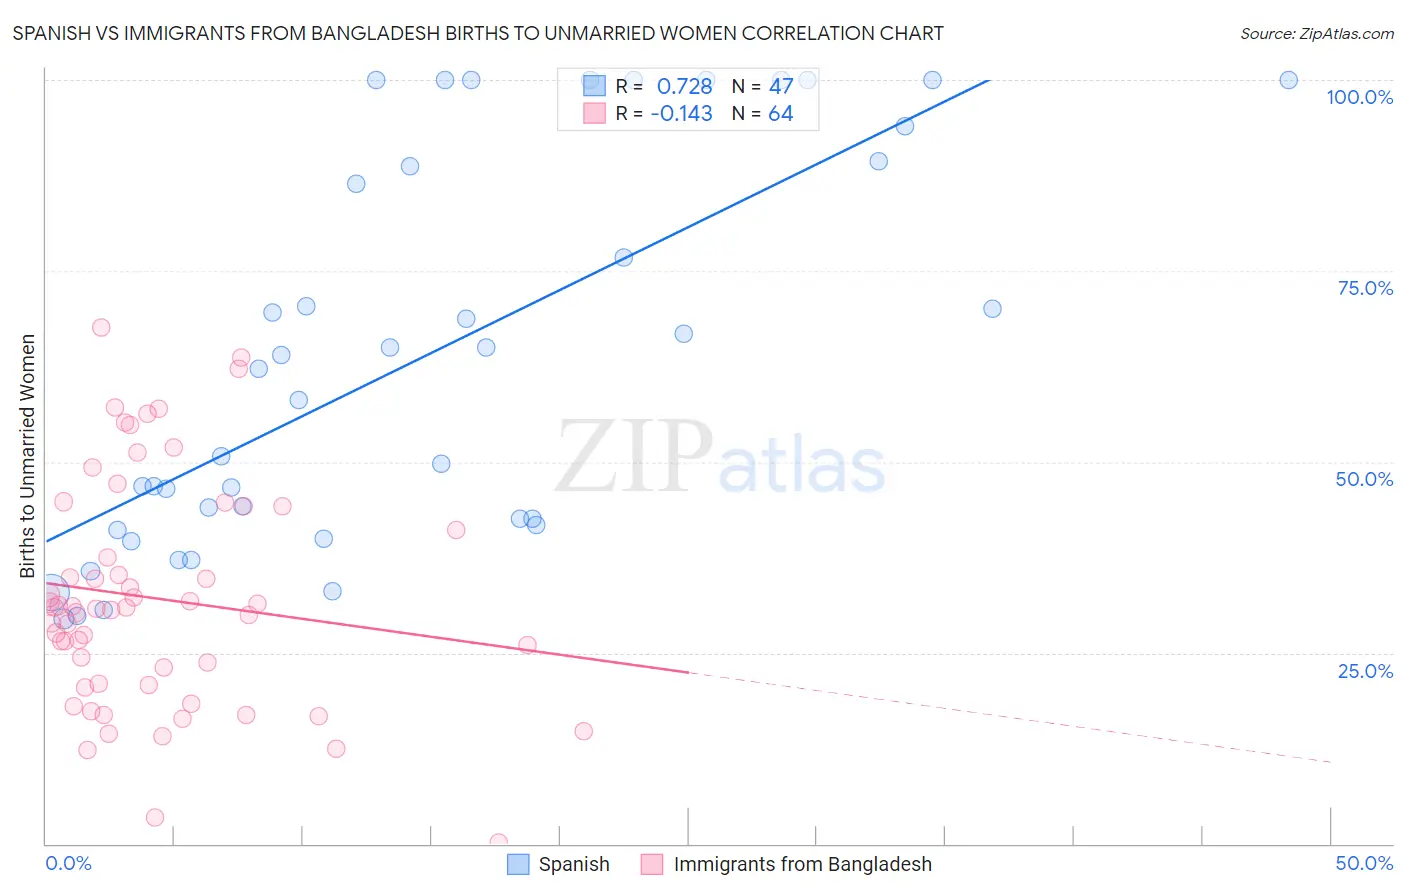
Spanish vs Immigrants from Bangladesh Births to Unmarried Women Correlation Chart
The statistical analysis conducted on geographies consisting of 393,000,764 people shows a strong positive correlation between the proportion of Spanish and percentage of births to unmarried women in the United States with a correlation coefficient (R) of 0.728 and weighted average of 34.1%. Similarly, the statistical analysis conducted on geographies consisting of 195,686,757 people shows a poor negative correlation between the proportion of Immigrants from Bangladesh and percentage of births to unmarried women in the United States with a correlation coefficient (R) of -0.143 and weighted average of 30.9%, a difference of 10.2%.
Births to Unmarried Women Correlation Summary
| Measurement | Spanish | Immigrants from Bangladesh |
| Minimum | 29.5% | 0.20% |
| Maximum | 100.0% | 67.6% |
| Range | 70.5% | 67.4% |
| Mean | 63.5% | 32.1% |
| Median | 62.2% | 30.8% |
| Interquartile 25% (IQ1) | 41.7% | 20.9% |
| Interquartile 75% (IQ3) | 89.4% | 42.6% |
| Interquartile Range (IQR) | 47.7% | 21.8% |
| Standard Deviation (Sample) | 25.1% | 14.9% |
| Standard Deviation (Population) | 24.9% | 14.8% |
Similar Demographics by Births to Unmarried Women
Demographics Similar to Spanish by Births to Unmarried Women
In terms of births to unmarried women, the demographic groups most similar to Spanish are Immigrants from Laos (34.0%, a difference of 0.16%), Pennsylvania German (34.0%, a difference of 0.17%), Delaware (34.2%, a difference of 0.39%), Immigrants from Panama (34.2%, a difference of 0.41%), and Panamanian (34.2%, a difference of 0.44%).
| Demographics | Rating | Rank | Births to Unmarried Women |
| Immigrants | Ecuador | 5.9 /100 | #218 | Tragic 33.7% |
| Alsatians | 5.4 /100 | #219 | Tragic 33.8% |
| Portuguese | 5.4 /100 | #220 | Tragic 33.8% |
| Malaysians | 5.0 /100 | #221 | Tragic 33.9% |
| Immigrants | Uruguay | 4.8 /100 | #222 | Tragic 33.9% |
| Pennsylvania Germans | 4.3 /100 | #223 | Tragic 34.0% |
| Immigrants | Laos | 4.3 /100 | #224 | Tragic 34.0% |
| Spanish | 4.0 /100 | #225 | Tragic 34.1% |
| Delaware | 3.3 /100 | #226 | Tragic 34.2% |
| Immigrants | Panama | 3.3 /100 | #227 | Tragic 34.2% |
| Panamanians | 3.3 /100 | #228 | Tragic 34.2% |
| Immigrants | Sierra Leone | 3.1 /100 | #229 | Tragic 34.2% |
| Ghanaians | 3.1 /100 | #230 | Tragic 34.3% |
| Native Hawaiians | 2.9 /100 | #231 | Tragic 34.3% |
| French Canadians | 2.5 /100 | #232 | Tragic 34.4% |
Demographics Similar to Immigrants from Bangladesh by Births to Unmarried Women
In terms of births to unmarried women, the demographic groups most similar to Immigrants from Bangladesh are Carpatho Rusyn (30.9%, a difference of 0.050%), Yugoslavian (30.8%, a difference of 0.15%), Immigrants from Eastern Africa (31.0%, a difference of 0.22%), British (30.8%, a difference of 0.27%), and Polish (30.8%, a difference of 0.29%).
| Demographics | Rating | Rank | Births to Unmarried Women |
| Chileans | 79.1 /100 | #148 | Good 30.7% |
| Serbians | 78.8 /100 | #149 | Good 30.7% |
| Somalis | 77.8 /100 | #150 | Good 30.7% |
| Italians | 77.0 /100 | #151 | Good 30.8% |
| Poles | 76.2 /100 | #152 | Good 30.8% |
| British | 76.0 /100 | #153 | Good 30.8% |
| Yugoslavians | 75.1 /100 | #154 | Good 30.8% |
| Immigrants | Bangladesh | 73.9 /100 | #155 | Good 30.9% |
| Carpatho Rusyns | 73.5 /100 | #156 | Good 30.9% |
| Immigrants | Eastern Africa | 72.1 /100 | #157 | Good 31.0% |
| Austrians | 69.9 /100 | #158 | Good 31.0% |
| Immigrants | England | 69.4 /100 | #159 | Good 31.1% |
| Immigrants | Western Europe | 69.3 /100 | #160 | Good 31.1% |
| Immigrants | Southern Europe | 68.7 /100 | #161 | Good 31.1% |
| Slovenes | 65.9 /100 | #162 | Good 31.2% |