Immigrants from South Eastern Asia vs Paiute Single Mother Households
COMPARE
Immigrants from South Eastern Asia
Paiute
Single Mother Households
Single Mother Households Comparison
Immigrants from South Eastern Asia
Paiute
6.3%
SINGLE MOTHER HOUSEHOLDS
52.2/ 100
METRIC RATING
172nd/ 347
METRIC RANK
7.0%
SINGLE MOTHER HOUSEHOLDS
2.4/ 100
METRIC RATING
226th/ 347
METRIC RANK
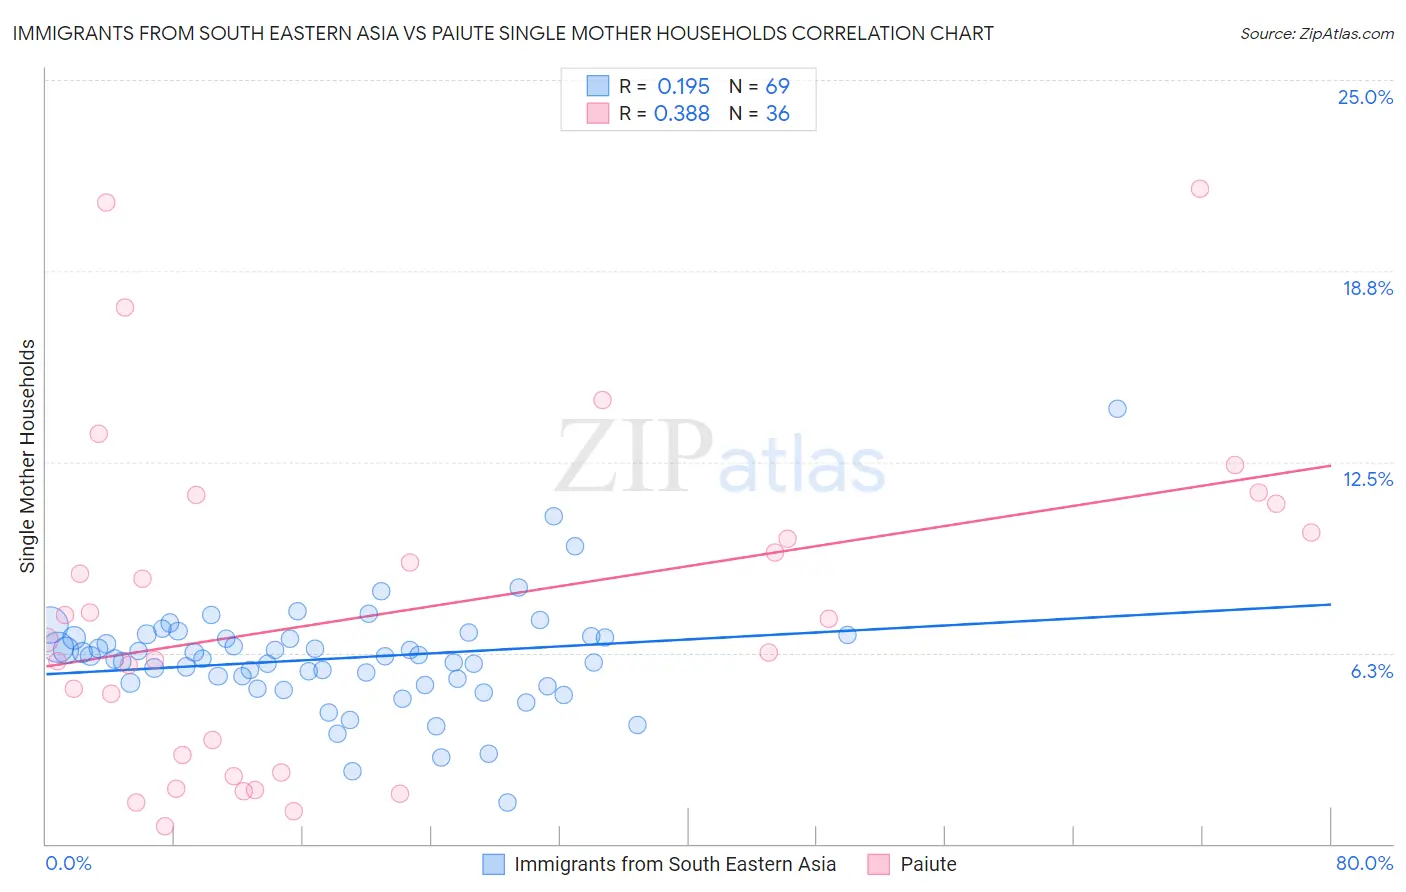
Immigrants from South Eastern Asia vs Paiute Single Mother Households Correlation Chart
The statistical analysis conducted on geographies consisting of 510,269,727 people shows a poor positive correlation between the proportion of Immigrants from South Eastern Asia and percentage of single mother households in the United States with a correlation coefficient (R) of 0.195 and weighted average of 6.3%. Similarly, the statistical analysis conducted on geographies consisting of 58,356,000 people shows a mild positive correlation between the proportion of Paiute and percentage of single mother households in the United States with a correlation coefficient (R) of 0.388 and weighted average of 7.0%, a difference of 10.4%.
Single Mother Households Correlation Summary
| Measurement | Immigrants from South Eastern Asia | Paiute |
| Minimum | 1.4% | 0.59% |
| Maximum | 14.2% | 21.4% |
| Range | 12.9% | 20.8% |
| Mean | 6.1% | 7.6% |
| Median | 6.1% | 7.0% |
| Interquartile 25% (IQ1) | 5.2% | 2.6% |
| Interquartile 75% (IQ3) | 6.8% | 10.7% |
| Interquartile Range (IQR) | 1.6% | 8.0% |
| Standard Deviation (Sample) | 1.8% | 5.4% |
| Standard Deviation (Population) | 1.8% | 5.3% |
Similar Demographics by Single Mother Households
Demographics Similar to Immigrants from South Eastern Asia by Single Mother Households
In terms of single mother households, the demographic groups most similar to Immigrants from South Eastern Asia are Afghan (6.3%, a difference of 0.040%), Immigrants from Vietnam (6.3%, a difference of 0.070%), Immigrants from Morocco (6.3%, a difference of 0.24%), Immigrants from Oceania (6.3%, a difference of 0.26%), and Puget Sound Salish (6.3%, a difference of 0.66%).
| Demographics | Rating | Rank | Single Mother Households |
| Immigrants | Syria | 67.4 /100 | #165 | Good 6.2% |
| Sri Lankans | 63.9 /100 | #166 | Good 6.2% |
| Brazilians | 59.1 /100 | #167 | Average 6.2% |
| Immigrants | Chile | 58.3 /100 | #168 | Average 6.3% |
| Puget Sound Salish | 58.1 /100 | #169 | Average 6.3% |
| Immigrants | Oceania | 54.6 /100 | #170 | Average 6.3% |
| Afghans | 52.5 /100 | #171 | Average 6.3% |
| Immigrants | South Eastern Asia | 52.2 /100 | #172 | Average 6.3% |
| Immigrants | Vietnam | 51.5 /100 | #173 | Average 6.3% |
| Immigrants | Morocco | 50.0 /100 | #174 | Average 6.3% |
| Marshallese | 45.8 /100 | #175 | Average 6.3% |
| Immigrants | Bosnia and Herzegovina | 44.3 /100 | #176 | Average 6.3% |
| Osage | 43.0 /100 | #177 | Average 6.4% |
| Portuguese | 40.0 /100 | #178 | Fair 6.4% |
| Hmong | 39.8 /100 | #179 | Fair 6.4% |
Demographics Similar to Paiute by Single Mother Households
In terms of single mother households, the demographic groups most similar to Paiute are Kenyan (7.0%, a difference of 0.14%), Iroquois (7.0%, a difference of 0.17%), Immigrants from Kenya (7.0%, a difference of 0.34%), Sudanese (6.9%, a difference of 0.68%), and Immigrants from Sudan (6.9%, a difference of 0.96%).
| Demographics | Rating | Rank | Single Mother Households |
| Immigrants | Immigrants | 4.3 /100 | #219 | Tragic 6.8% |
| Immigrants | Thailand | 4.0 /100 | #220 | Tragic 6.9% |
| French American Indians | 3.7 /100 | #221 | Tragic 6.9% |
| Immigrants | Bangladesh | 3.7 /100 | #222 | Tragic 6.9% |
| Immigrants | Micronesia | 3.6 /100 | #223 | Tragic 6.9% |
| Immigrants | Sudan | 3.5 /100 | #224 | Tragic 6.9% |
| Sudanese | 3.1 /100 | #225 | Tragic 6.9% |
| Paiute | 2.4 /100 | #226 | Tragic 7.0% |
| Kenyans | 2.3 /100 | #227 | Tragic 7.0% |
| Iroquois | 2.2 /100 | #228 | Tragic 7.0% |
| Immigrants | Kenya | 2.1 /100 | #229 | Tragic 7.0% |
| Creek | 1.6 /100 | #230 | Tragic 7.0% |
| Spanish Americans | 1.6 /100 | #231 | Tragic 7.0% |
| Comanche | 1.5 /100 | #232 | Tragic 7.0% |
| Choctaw | 1.4 /100 | #233 | Tragic 7.0% |