Liberian vs Paiute Single Mother Households
COMPARE
Liberian
Paiute
Single Mother Households
Single Mother Households Comparison
Liberians
Paiute
8.6%
SINGLE MOTHER HOUSEHOLDS
0.0/ 100
METRIC RATING
333rd/ 347
METRIC RANK
7.0%
SINGLE MOTHER HOUSEHOLDS
2.4/ 100
METRIC RATING
226th/ 347
METRIC RANK
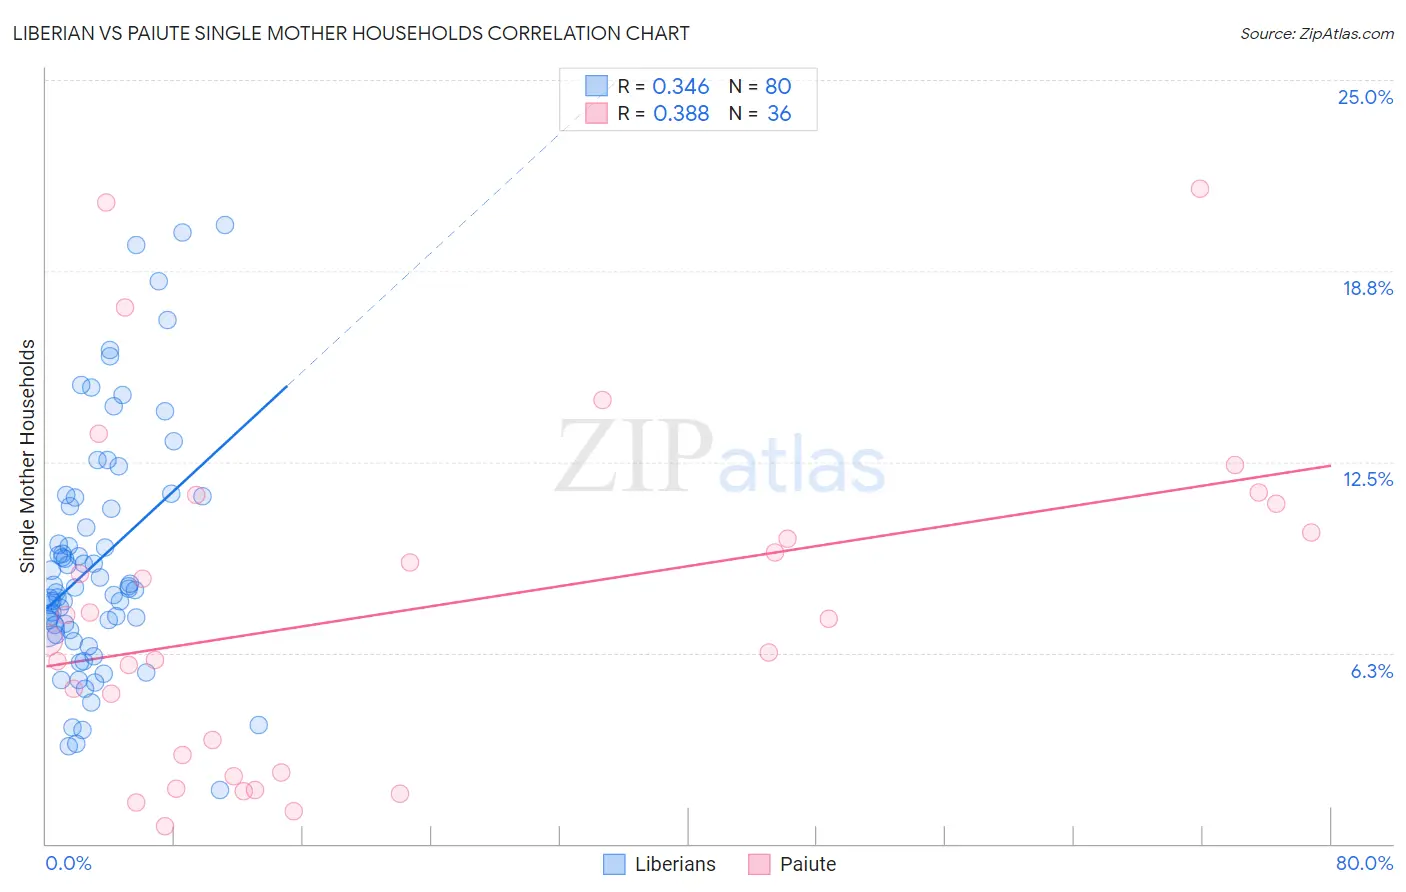
Liberian vs Paiute Single Mother Households Correlation Chart
The statistical analysis conducted on geographies consisting of 118,018,313 people shows a mild positive correlation between the proportion of Liberians and percentage of single mother households in the United States with a correlation coefficient (R) of 0.346 and weighted average of 8.6%. Similarly, the statistical analysis conducted on geographies consisting of 58,356,000 people shows a mild positive correlation between the proportion of Paiute and percentage of single mother households in the United States with a correlation coefficient (R) of 0.388 and weighted average of 7.0%, a difference of 24.3%.
Single Mother Households Correlation Summary
| Measurement | Liberian | Paiute |
| Minimum | 1.7% | 0.59% |
| Maximum | 20.2% | 21.4% |
| Range | 18.5% | 20.8% |
| Mean | 9.3% | 7.6% |
| Median | 8.4% | 7.0% |
| Interquartile 25% (IQ1) | 7.0% | 2.6% |
| Interquartile 75% (IQ3) | 11.2% | 10.7% |
| Interquartile Range (IQR) | 4.2% | 8.0% |
| Standard Deviation (Sample) | 4.0% | 5.4% |
| Standard Deviation (Population) | 3.9% | 5.3% |
Similar Demographics by Single Mother Households
Demographics Similar to Liberians by Single Mother Households
In terms of single mother households, the demographic groups most similar to Liberians are U.S. Virgin Islander (8.6%, a difference of 0.33%), Immigrants from Liberia (8.7%, a difference of 0.80%), Immigrants from Dominica (8.7%, a difference of 1.1%), Puerto Rican (8.7%, a difference of 1.1%), and Inupiat (8.5%, a difference of 1.8%).
| Demographics | Rating | Rank | Single Mother Households |
| British West Indians | 0.0 /100 | #326 | Tragic 8.4% |
| Immigrants | Haiti | 0.0 /100 | #327 | Tragic 8.4% |
| Yakama | 0.0 /100 | #328 | Tragic 8.4% |
| Hopi | 0.0 /100 | #329 | Tragic 8.5% |
| Inupiat | 0.0 /100 | #330 | Tragic 8.5% |
| Sioux | 0.0 /100 | #331 | Tragic 8.5% |
| U.S. Virgin Islanders | 0.0 /100 | #332 | Tragic 8.6% |
| Liberians | 0.0 /100 | #333 | Tragic 8.6% |
| Immigrants | Liberia | 0.0 /100 | #334 | Tragic 8.7% |
| Immigrants | Dominica | 0.0 /100 | #335 | Tragic 8.7% |
| Puerto Ricans | 0.0 /100 | #336 | Tragic 8.7% |
| Navajo | 0.0 /100 | #337 | Tragic 8.8% |
| Cape Verdeans | 0.0 /100 | #338 | Tragic 8.9% |
| Blacks/African Americans | 0.0 /100 | #339 | Tragic 9.0% |
| Lumbee | 0.0 /100 | #340 | Tragic 9.1% |
Demographics Similar to Paiute by Single Mother Households
In terms of single mother households, the demographic groups most similar to Paiute are Kenyan (7.0%, a difference of 0.14%), Iroquois (7.0%, a difference of 0.17%), Immigrants from Kenya (7.0%, a difference of 0.34%), Sudanese (6.9%, a difference of 0.68%), and Immigrants from Sudan (6.9%, a difference of 0.96%).
| Demographics | Rating | Rank | Single Mother Households |
| Immigrants | Immigrants | 4.3 /100 | #219 | Tragic 6.8% |
| Immigrants | Thailand | 4.0 /100 | #220 | Tragic 6.9% |
| French American Indians | 3.7 /100 | #221 | Tragic 6.9% |
| Immigrants | Bangladesh | 3.7 /100 | #222 | Tragic 6.9% |
| Immigrants | Micronesia | 3.6 /100 | #223 | Tragic 6.9% |
| Immigrants | Sudan | 3.5 /100 | #224 | Tragic 6.9% |
| Sudanese | 3.1 /100 | #225 | Tragic 6.9% |
| Paiute | 2.4 /100 | #226 | Tragic 7.0% |
| Kenyans | 2.3 /100 | #227 | Tragic 7.0% |
| Iroquois | 2.2 /100 | #228 | Tragic 7.0% |
| Immigrants | Kenya | 2.1 /100 | #229 | Tragic 7.0% |
| Creek | 1.6 /100 | #230 | Tragic 7.0% |
| Spanish Americans | 1.6 /100 | #231 | Tragic 7.0% |
| Comanche | 1.5 /100 | #232 | Tragic 7.0% |
| Choctaw | 1.4 /100 | #233 | Tragic 7.0% |