Immigrants from Thailand vs Paiute Single Mother Households
COMPARE
Immigrants from Thailand
Paiute
Single Mother Households
Single Mother Households Comparison
Immigrants from Thailand
Paiute
6.9%
SINGLE MOTHER HOUSEHOLDS
4.0/ 100
METRIC RATING
220th/ 347
METRIC RANK
7.0%
SINGLE MOTHER HOUSEHOLDS
2.4/ 100
METRIC RATING
226th/ 347
METRIC RANK
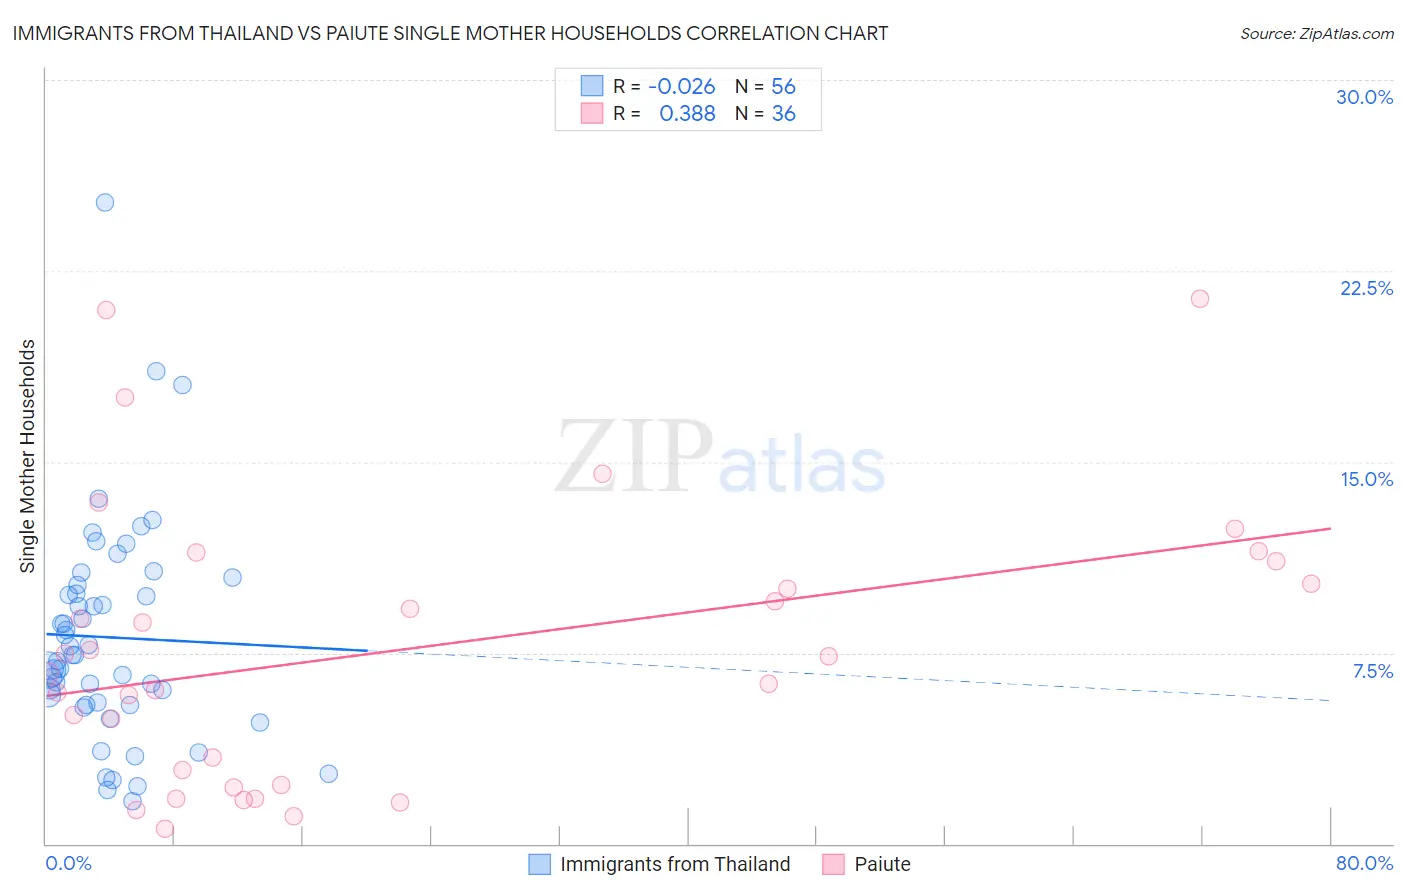
Immigrants from Thailand vs Paiute Single Mother Households Correlation Chart
The statistical analysis conducted on geographies consisting of 316,498,474 people shows no correlation between the proportion of Immigrants from Thailand and percentage of single mother households in the United States with a correlation coefficient (R) of -0.026 and weighted average of 6.9%. Similarly, the statistical analysis conducted on geographies consisting of 58,356,000 people shows a mild positive correlation between the proportion of Paiute and percentage of single mother households in the United States with a correlation coefficient (R) of 0.388 and weighted average of 7.0%, a difference of 1.3%.
Single Mother Households Correlation Summary
| Measurement | Immigrants from Thailand | Paiute |
| Minimum | 1.7% | 0.59% |
| Maximum | 25.2% | 21.4% |
| Range | 23.6% | 20.8% |
| Mean | 8.1% | 7.6% |
| Median | 7.4% | 7.0% |
| Interquartile 25% (IQ1) | 5.5% | 2.6% |
| Interquartile 75% (IQ3) | 10.0% | 10.7% |
| Interquartile Range (IQR) | 4.5% | 8.0% |
| Standard Deviation (Sample) | 4.3% | 5.4% |
| Standard Deviation (Population) | 4.2% | 5.3% |
Demographics Similar to Immigrants from Thailand and Paiute by Single Mother Households
In terms of single mother households, the demographic groups most similar to Immigrants from Thailand are Immigrants (6.8%, a difference of 0.18%), French American Indian (6.9%, a difference of 0.19%), Immigrants from Bangladesh (6.9%, a difference of 0.22%), Immigrants from Micronesia (6.9%, a difference of 0.26%), and Immigrants from Eastern Africa (6.8%, a difference of 0.27%). Similarly, the demographic groups most similar to Paiute are Kenyan (7.0%, a difference of 0.14%), Iroquois (7.0%, a difference of 0.17%), Immigrants from Kenya (7.0%, a difference of 0.34%), Sudanese (6.9%, a difference of 0.68%), and Immigrants from Sudan (6.9%, a difference of 0.96%).
| Demographics | Rating | Rank | Single Mother Households |
| Immigrants | Costa Rica | 8.2 /100 | #213 | Tragic 6.7% |
| Immigrants | Uruguay | 7.9 /100 | #214 | Tragic 6.7% |
| Shoshone | 5.7 /100 | #215 | Tragic 6.8% |
| Cherokee | 5.1 /100 | #216 | Tragic 6.8% |
| Aleuts | 4.8 /100 | #217 | Tragic 6.8% |
| Immigrants | Eastern Africa | 4.4 /100 | #218 | Tragic 6.8% |
| Immigrants | Immigrants | 4.3 /100 | #219 | Tragic 6.8% |
| Immigrants | Thailand | 4.0 /100 | #220 | Tragic 6.9% |
| French American Indians | 3.7 /100 | #221 | Tragic 6.9% |
| Immigrants | Bangladesh | 3.7 /100 | #222 | Tragic 6.9% |
| Immigrants | Micronesia | 3.6 /100 | #223 | Tragic 6.9% |
| Immigrants | Sudan | 3.5 /100 | #224 | Tragic 6.9% |
| Sudanese | 3.1 /100 | #225 | Tragic 6.9% |
| Paiute | 2.4 /100 | #226 | Tragic 7.0% |
| Kenyans | 2.3 /100 | #227 | Tragic 7.0% |
| Iroquois | 2.2 /100 | #228 | Tragic 7.0% |
| Immigrants | Kenya | 2.1 /100 | #229 | Tragic 7.0% |
| Creek | 1.6 /100 | #230 | Tragic 7.0% |
| Spanish Americans | 1.6 /100 | #231 | Tragic 7.0% |
| Comanche | 1.5 /100 | #232 | Tragic 7.0% |
| Choctaw | 1.4 /100 | #233 | Tragic 7.0% |