Armenian vs Paiute Births to Unmarried Women
COMPARE
Armenian
Paiute
Births to Unmarried Women
Births to Unmarried Women Comparison
Armenians
Paiute
26.2%
BIRTHS TO UNMARRIED WOMEN
99.9/ 100
METRIC RATING
19th/ 347
METRIC RANK
42.5%
BIRTHS TO UNMARRIED WOMEN
0.0/ 100
METRIC RATING
329th/ 347
METRIC RANK
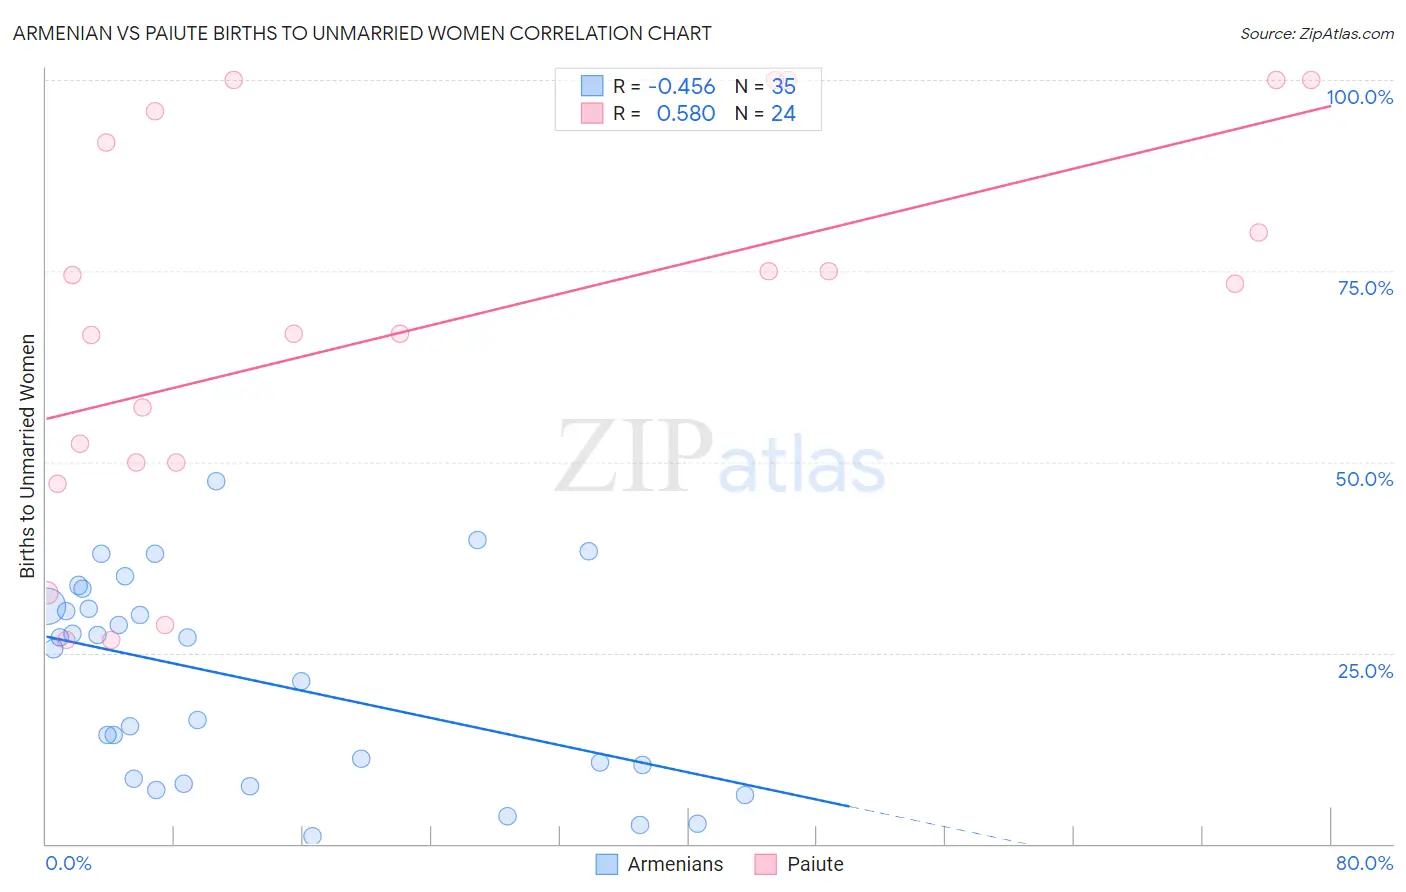
Armenian vs Paiute Births to Unmarried Women Correlation Chart
The statistical analysis conducted on geographies consisting of 289,699,675 people shows a moderate negative correlation between the proportion of Armenians and percentage of births to unmarried women in the United States with a correlation coefficient (R) of -0.456 and weighted average of 26.2%. Similarly, the statistical analysis conducted on geographies consisting of 57,331,640 people shows a substantial positive correlation between the proportion of Paiute and percentage of births to unmarried women in the United States with a correlation coefficient (R) of 0.580 and weighted average of 42.5%, a difference of 62.0%.
Births to Unmarried Women Correlation Summary
| Measurement | Armenian | Paiute |
| Minimum | 1.0% | 26.6% |
| Maximum | 47.5% | 100.0% |
| Range | 46.5% | 73.4% |
| Mean | 21.4% | 68.2% |
| Median | 25.5% | 70.0% |
| Interquartile 25% (IQ1) | 8.5% | 50.0% |
| Interquartile 75% (IQ3) | 31.1% | 93.9% |
| Interquartile Range (IQR) | 22.6% | 43.9% |
| Standard Deviation (Sample) | 13.1% | 25.1% |
| Standard Deviation (Population) | 12.9% | 24.5% |
Similar Demographics by Births to Unmarried Women
Demographics Similar to Armenians by Births to Unmarried Women
In terms of births to unmarried women, the demographic groups most similar to Armenians are Immigrants from Korea (26.3%, a difference of 0.21%), Soviet Union (26.3%, a difference of 0.35%), Burmese (26.4%, a difference of 0.57%), Immigrants from Armenia (26.1%, a difference of 0.58%), and Immigrants from Japan (26.4%, a difference of 0.76%).
| Demographics | Rating | Rank | Births to Unmarried Women |
| Indians (Asian) | 100.0 /100 | #12 | Exceptional 25.3% |
| Iranians | 100.0 /100 | #13 | Exceptional 25.3% |
| Immigrants | Lebanon | 100.0 /100 | #14 | Exceptional 25.3% |
| Immigrants | Singapore | 100.0 /100 | #15 | Exceptional 25.6% |
| Immigrants | Belarus | 100.0 /100 | #16 | Exceptional 25.6% |
| Immigrants | Uzbekistan | 100.0 /100 | #17 | Exceptional 25.8% |
| Immigrants | Armenia | 99.9 /100 | #18 | Exceptional 26.1% |
| Armenians | 99.9 /100 | #19 | Exceptional 26.2% |
| Immigrants | Korea | 99.9 /100 | #20 | Exceptional 26.3% |
| Soviet Union | 99.9 /100 | #21 | Exceptional 26.3% |
| Burmese | 99.9 /100 | #22 | Exceptional 26.4% |
| Immigrants | Japan | 99.9 /100 | #23 | Exceptional 26.4% |
| Immigrants | Australia | 99.9 /100 | #24 | Exceptional 26.6% |
| Cambodians | 99.9 /100 | #25 | Exceptional 26.7% |
| Asians | 99.9 /100 | #26 | Exceptional 26.8% |
Demographics Similar to Paiute by Births to Unmarried Women
In terms of births to unmarried women, the demographic groups most similar to Paiute are Chippewa (42.6%, a difference of 0.40%), Immigrants from Cabo Verde (42.2%, a difference of 0.60%), Tsimshian (42.2%, a difference of 0.74%), Native/Alaskan (43.0%, a difference of 1.2%), and Kiowa (43.1%, a difference of 1.6%).
| Demographics | Rating | Rank | Births to Unmarried Women |
| Cajuns | 0.0 /100 | #322 | Tragic 41.0% |
| Sioux | 0.0 /100 | #323 | Tragic 41.0% |
| Cape Verdeans | 0.0 /100 | #324 | Tragic 41.3% |
| Cheyenne | 0.0 /100 | #325 | Tragic 41.3% |
| Immigrants | Cuba | 0.0 /100 | #326 | Tragic 41.5% |
| Tsimshian | 0.0 /100 | #327 | Tragic 42.2% |
| Immigrants | Cabo Verde | 0.0 /100 | #328 | Tragic 42.2% |
| Paiute | 0.0 /100 | #329 | Tragic 42.5% |
| Chippewa | 0.0 /100 | #330 | Tragic 42.6% |
| Natives/Alaskans | 0.0 /100 | #331 | Tragic 43.0% |
| Kiowa | 0.0 /100 | #332 | Tragic 43.1% |
| Blacks/African Americans | 0.0 /100 | #333 | Tragic 44.3% |
| Yuman | 0.0 /100 | #334 | Tragic 44.4% |
| Colville | 0.0 /100 | #335 | Tragic 45.3% |
| Puerto Ricans | 0.0 /100 | #336 | Tragic 45.7% |