Scandinavian vs Immigrants from Latin America Divorced or Separated
COMPARE
Scandinavian
Immigrants from Latin America
Divorced or Separated
Divorced or Separated Comparison
Scandinavians
Immigrants from Latin America
12.3%
DIVORCED OR SEPARATED
10.4/ 100
METRIC RATING
223rd/ 347
METRIC RANK
12.4%
DIVORCED OR SEPARATED
2.8/ 100
METRIC RATING
243rd/ 347
METRIC RANK
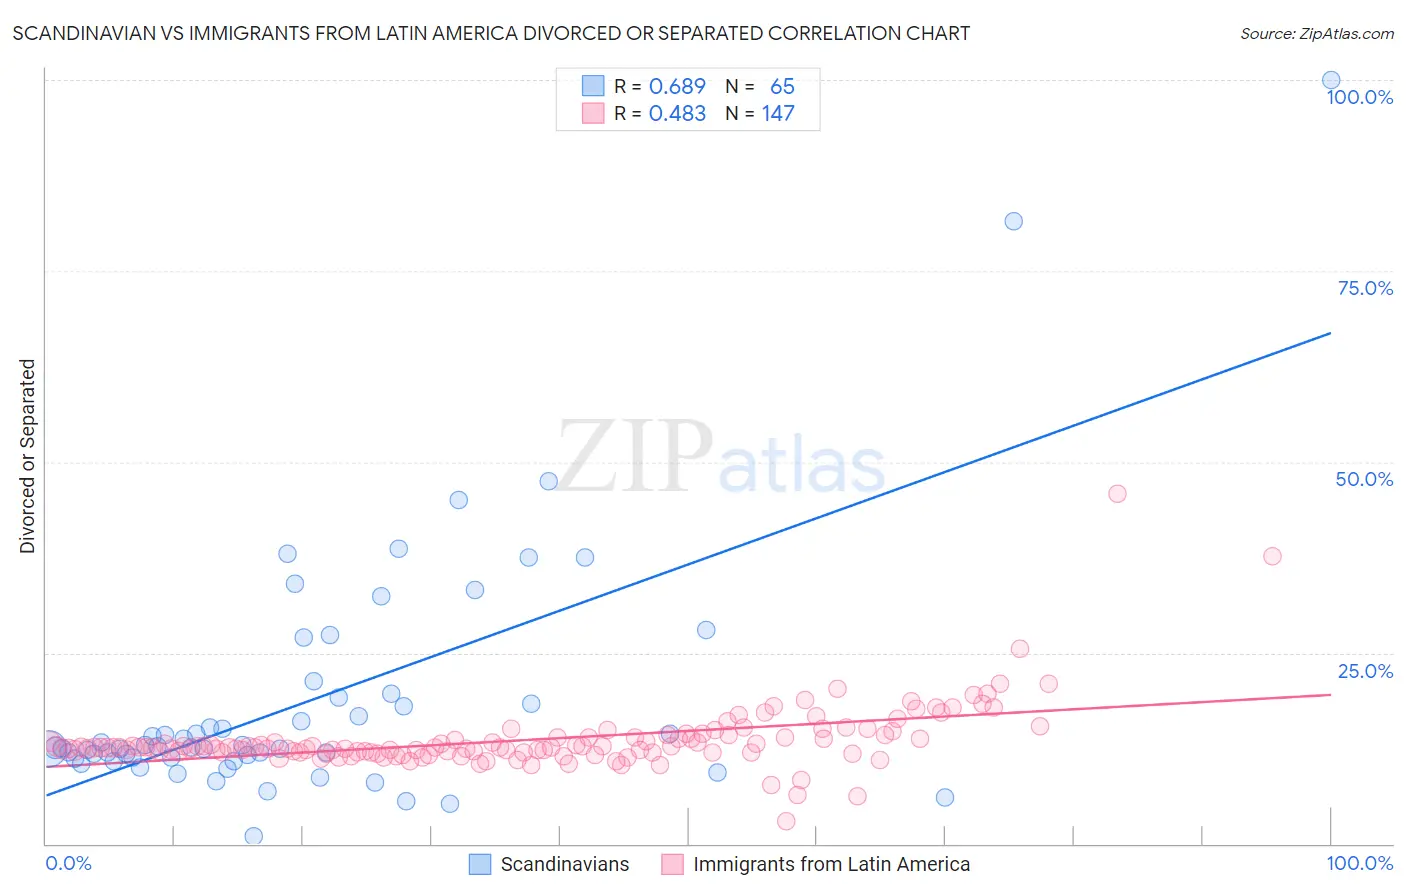
Scandinavian vs Immigrants from Latin America Divorced or Separated Correlation Chart
The statistical analysis conducted on geographies consisting of 472,421,001 people shows a significant positive correlation between the proportion of Scandinavians and percentage of population currently divorced or separated in the United States with a correlation coefficient (R) of 0.689 and weighted average of 12.3%. Similarly, the statistical analysis conducted on geographies consisting of 558,222,982 people shows a moderate positive correlation between the proportion of Immigrants from Latin America and percentage of population currently divorced or separated in the United States with a correlation coefficient (R) of 0.483 and weighted average of 12.4%, a difference of 1.2%.
Divorced or Separated Correlation Summary
| Measurement | Scandinavian | Immigrants from Latin America |
| Minimum | 1.0% | 3.0% |
| Maximum | 100.0% | 45.8% |
| Range | 99.0% | 42.8% |
| Mean | 18.9% | 13.6% |
| Median | 12.6% | 12.6% |
| Interquartile 25% (IQ1) | 11.2% | 12.0% |
| Interquartile 75% (IQ3) | 19.4% | 13.9% |
| Interquartile Range (IQR) | 8.2% | 1.9% |
| Standard Deviation (Sample) | 16.4% | 4.3% |
| Standard Deviation (Population) | 16.3% | 4.3% |
Demographics Similar to Scandinavians and Immigrants from Latin America by Divorced or Separated
In terms of divorced or separated, the demographic groups most similar to Scandinavians are Immigrants from the Azores (12.3%, a difference of 0.070%), Belgian (12.3%, a difference of 0.070%), Immigrants from Western Africa (12.3%, a difference of 0.10%), Hmong (12.3%, a difference of 0.16%), and Immigrants from Cameroon (12.3%, a difference of 0.21%). Similarly, the demographic groups most similar to Immigrants from Latin America are Dutch (12.4%, a difference of 0.070%), Uruguayan (12.4%, a difference of 0.15%), British West Indian (12.4%, a difference of 0.24%), Immigrants from Germany (12.4%, a difference of 0.29%), and Sudanese (12.4%, a difference of 0.30%).
| Demographics | Rating | Rank | Divorced or Separated |
| Scandinavians | 10.4 /100 | #223 | Poor 12.3% |
| Immigrants | Azores | 9.7 /100 | #224 | Tragic 12.3% |
| Belgians | 9.7 /100 | #225 | Tragic 12.3% |
| Immigrants | Western Africa | 9.3 /100 | #226 | Tragic 12.3% |
| Hmong | 8.8 /100 | #227 | Tragic 12.3% |
| Immigrants | Cameroon | 8.3 /100 | #228 | Tragic 12.3% |
| Immigrants | Sudan | 8.2 /100 | #229 | Tragic 12.3% |
| Yakama | 7.8 /100 | #230 | Tragic 12.3% |
| Yugoslavians | 6.6 /100 | #231 | Tragic 12.3% |
| Canadians | 5.3 /100 | #232 | Tragic 12.4% |
| Malaysians | 4.8 /100 | #233 | Tragic 12.4% |
| West Indians | 4.4 /100 | #234 | Tragic 12.4% |
| Immigrants | Bosnia and Herzegovina | 4.3 /100 | #235 | Tragic 12.4% |
| Colombians | 4.2 /100 | #236 | Tragic 12.4% |
| Immigrants | Laos | 4.2 /100 | #237 | Tragic 12.4% |
| Sudanese | 4.0 /100 | #238 | Tragic 12.4% |
| Immigrants | Germany | 4.0 /100 | #239 | Tragic 12.4% |
| British West Indians | 3.7 /100 | #240 | Tragic 12.4% |
| Uruguayans | 3.4 /100 | #241 | Tragic 12.4% |
| Dutch | 3.1 /100 | #242 | Tragic 12.4% |
| Immigrants | Latin America | 2.8 /100 | #243 | Tragic 12.4% |