Basque vs Immigrants from Latin America Divorced or Separated
COMPARE
Basque
Immigrants from Latin America
Divorced or Separated
Divorced or Separated Comparison
Basques
Immigrants from Latin America
12.6%
DIVORCED OR SEPARATED
0.5/ 100
METRIC RATING
262nd/ 347
METRIC RANK
12.4%
DIVORCED OR SEPARATED
2.8/ 100
METRIC RATING
243rd/ 347
METRIC RANK
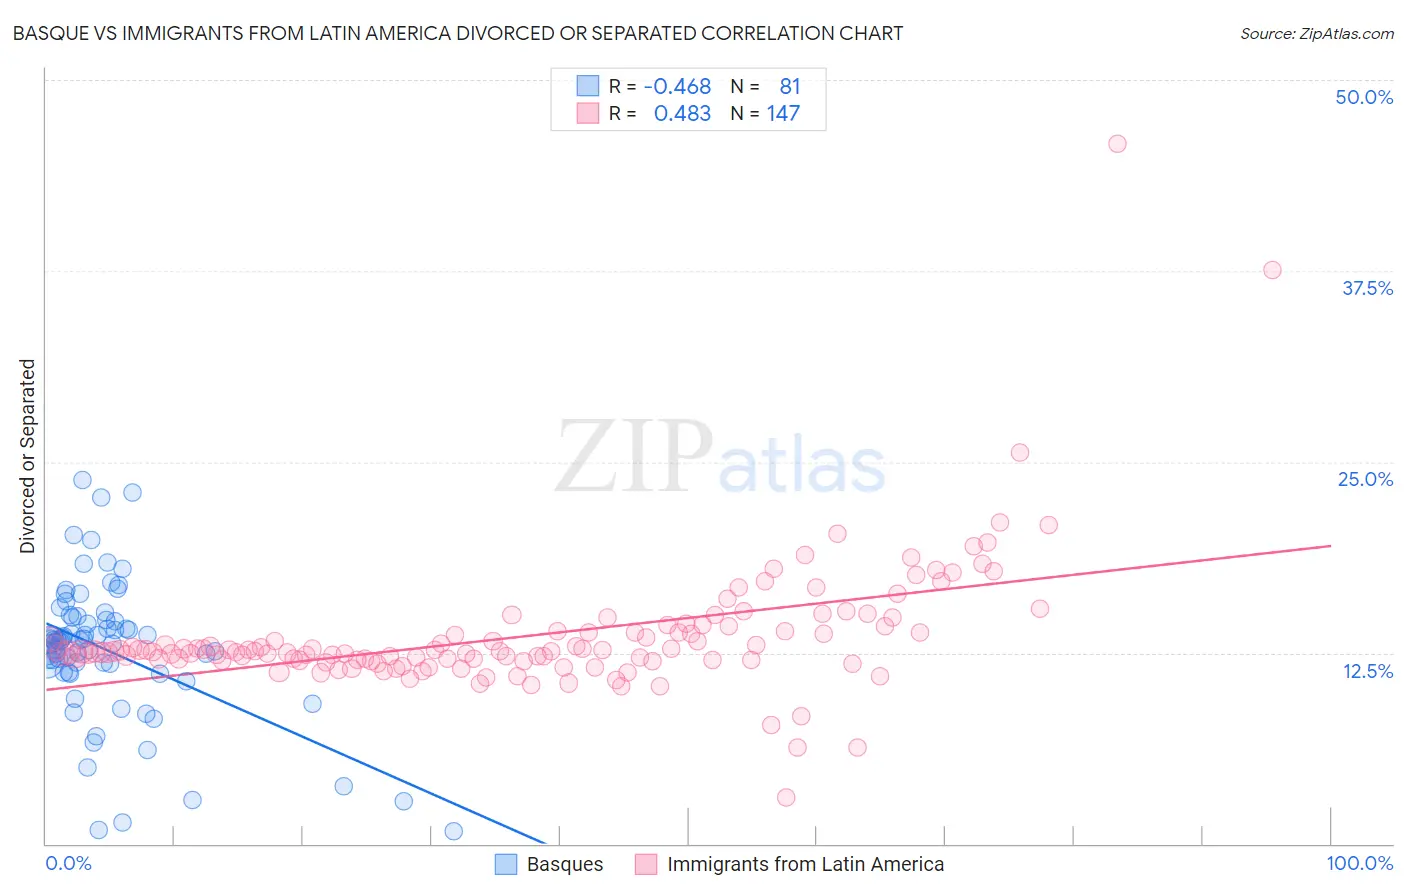
Basque vs Immigrants from Latin America Divorced or Separated Correlation Chart
The statistical analysis conducted on geographies consisting of 165,751,704 people shows a moderate negative correlation between the proportion of Basques and percentage of population currently divorced or separated in the United States with a correlation coefficient (R) of -0.468 and weighted average of 12.6%. Similarly, the statistical analysis conducted on geographies consisting of 558,222,982 people shows a moderate positive correlation between the proportion of Immigrants from Latin America and percentage of population currently divorced or separated in the United States with a correlation coefficient (R) of 0.483 and weighted average of 12.4%, a difference of 1.5%.
Divorced or Separated Correlation Summary
| Measurement | Basque | Immigrants from Latin America |
| Minimum | 0.80% | 3.0% |
| Maximum | 23.8% | 45.8% |
| Range | 23.0% | 42.8% |
| Mean | 12.7% | 13.6% |
| Median | 13.3% | 12.6% |
| Interquartile 25% (IQ1) | 11.2% | 12.0% |
| Interquartile 75% (IQ3) | 14.7% | 13.9% |
| Interquartile Range (IQR) | 3.5% | 1.9% |
| Standard Deviation (Sample) | 4.6% | 4.3% |
| Standard Deviation (Population) | 4.5% | 4.3% |
Demographics Similar to Basques and Immigrants from Latin America by Divorced or Separated
In terms of divorced or separated, the demographic groups most similar to Basques are Immigrants from Dominica (12.6%, a difference of 0.060%), Yuman (12.6%, a difference of 0.090%), Immigrants from Uruguay (12.6%, a difference of 0.090%), Immigrants from Somalia (12.6%, a difference of 0.11%), and Indonesian (12.6%, a difference of 0.11%). Similarly, the demographic groups most similar to Immigrants from Latin America are Dutch (12.4%, a difference of 0.070%), Alaska Native (12.4%, a difference of 0.10%), Hispanic or Latino (12.5%, a difference of 0.32%), Immigrants from West Indies (12.5%, a difference of 0.34%), and German (12.5%, a difference of 0.37%).
| Demographics | Rating | Rank | Divorced or Separated |
| Dutch | 3.1 /100 | #242 | Tragic 12.4% |
| Immigrants | Latin America | 2.8 /100 | #243 | Tragic 12.4% |
| Alaska Natives | 2.5 /100 | #244 | Tragic 12.4% |
| Hispanics or Latinos | 2.0 /100 | #245 | Tragic 12.5% |
| Immigrants | West Indies | 1.9 /100 | #246 | Tragic 12.5% |
| Germans | 1.8 /100 | #247 | Tragic 12.5% |
| Nepalese | 1.8 /100 | #248 | Tragic 12.5% |
| Finns | 1.8 /100 | #249 | Tragic 12.5% |
| Irish | 1.3 /100 | #250 | Tragic 12.5% |
| Aleuts | 1.3 /100 | #251 | Tragic 12.5% |
| Liberians | 0.9 /100 | #252 | Tragic 12.6% |
| Somalis | 0.9 /100 | #253 | Tragic 12.6% |
| Senegalese | 0.8 /100 | #254 | Tragic 12.6% |
| Welsh | 0.7 /100 | #255 | Tragic 12.6% |
| Immigrants | Colombia | 0.6 /100 | #256 | Tragic 12.6% |
| Immigrants | Somalia | 0.6 /100 | #257 | Tragic 12.6% |
| Indonesians | 0.6 /100 | #258 | Tragic 12.6% |
| Yuman | 0.6 /100 | #259 | Tragic 12.6% |
| Immigrants | Uruguay | 0.6 /100 | #260 | Tragic 12.6% |
| Immigrants | Dominica | 0.5 /100 | #261 | Tragic 12.6% |
| Basques | 0.5 /100 | #262 | Tragic 12.6% |