Spaniard vs Immigrants from Ghana 6th Grade
COMPARE
Spaniard
Immigrants from Ghana
6th Grade
6th Grade Comparison
Spaniards
Immigrants from Ghana
97.2%
6TH GRADE
80.1/ 100
METRIC RATING
145th/ 347
METRIC RANK
96.3%
6TH GRADE
0.1/ 100
METRIC RATING
275th/ 347
METRIC RANK
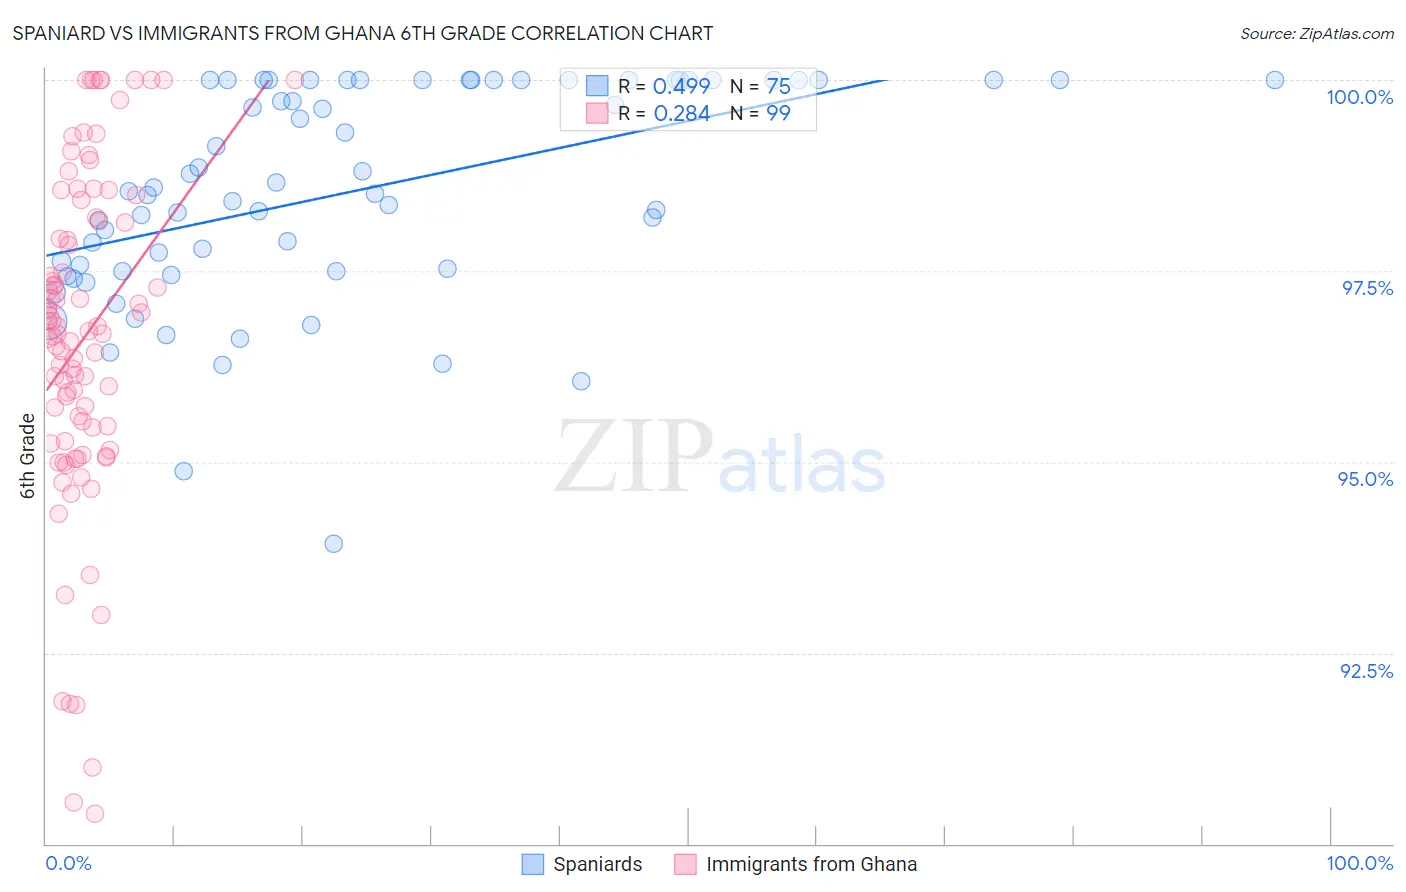
Spaniard vs Immigrants from Ghana 6th Grade Correlation Chart
The statistical analysis conducted on geographies consisting of 443,544,503 people shows a moderate positive correlation between the proportion of Spaniards and percentage of population with at least 6th grade education in the United States with a correlation coefficient (R) of 0.499 and weighted average of 97.2%. Similarly, the statistical analysis conducted on geographies consisting of 199,952,023 people shows a weak positive correlation between the proportion of Immigrants from Ghana and percentage of population with at least 6th grade education in the United States with a correlation coefficient (R) of 0.284 and weighted average of 96.3%, a difference of 0.96%.
6th Grade Correlation Summary
| Measurement | Spaniard | Immigrants from Ghana |
| Minimum | 93.9% | 90.4% |
| Maximum | 100.0% | 100.0% |
| Range | 6.1% | 9.6% |
| Mean | 98.5% | 96.6% |
| Median | 98.5% | 96.7% |
| Interquartile 25% (IQ1) | 97.5% | 95.3% |
| Interquartile 75% (IQ3) | 100.0% | 98.1% |
| Interquartile Range (IQR) | 2.5% | 2.9% |
| Standard Deviation (Sample) | 1.4% | 2.2% |
| Standard Deviation (Population) | 1.4% | 2.2% |
Similar Demographics by 6th Grade
Demographics Similar to Spaniards by 6th Grade
In terms of 6th grade, the demographic groups most similar to Spaniards are Hopi (97.2%, a difference of 0.010%), Immigrants from South Central Asia (97.2%, a difference of 0.010%), Pima (97.2%, a difference of 0.020%), Israeli (97.2%, a difference of 0.020%), and Immigrants from Greece (97.2%, a difference of 0.020%).
| Demographics | Rating | Rank | 6th Grade |
| Blackfeet | 87.7 /100 | #138 | Excellent 97.3% |
| Immigrants | Turkey | 86.1 /100 | #139 | Excellent 97.3% |
| Immigrants | North Macedonia | 85.5 /100 | #140 | Excellent 97.2% |
| Seminole | 84.8 /100 | #141 | Excellent 97.2% |
| Jordanians | 84.6 /100 | #142 | Excellent 97.2% |
| Pima | 82.9 /100 | #143 | Excellent 97.2% |
| Israelis | 82.9 /100 | #144 | Excellent 97.2% |
| Spaniards | 80.1 /100 | #145 | Excellent 97.2% |
| Hopi | 78.8 /100 | #146 | Good 97.2% |
| Immigrants | South Central Asia | 78.1 /100 | #147 | Good 97.2% |
| Immigrants | Greece | 77.8 /100 | #148 | Good 97.2% |
| Immigrants | Israel | 76.0 /100 | #149 | Good 97.2% |
| Immigrants | Bosnia and Herzegovina | 74.8 /100 | #150 | Good 97.2% |
| French American Indians | 74.0 /100 | #151 | Good 97.2% |
| Immigrants | Jordan | 73.0 /100 | #152 | Good 97.2% |
Demographics Similar to Immigrants from Ghana by 6th Grade
In terms of 6th grade, the demographic groups most similar to Immigrants from Ghana are Immigrants from Cameroon (96.3%, a difference of 0.010%), Immigrants from Philippines (96.3%, a difference of 0.010%), Yaqui (96.3%, a difference of 0.010%), Immigrants from Bolivia (96.3%, a difference of 0.020%), and Immigrants from Western Africa (96.3%, a difference of 0.020%).
| Demographics | Rating | Rank | 6th Grade |
| Immigrants | Uzbekistan | 0.2 /100 | #268 | Tragic 96.3% |
| West Indians | 0.2 /100 | #269 | Tragic 96.3% |
| Immigrants | South America | 0.2 /100 | #270 | Tragic 96.3% |
| Immigrants | Hong Kong | 0.2 /100 | #271 | Tragic 96.3% |
| Immigrants | Bolivia | 0.1 /100 | #272 | Tragic 96.3% |
| Immigrants | Cameroon | 0.1 /100 | #273 | Tragic 96.3% |
| Immigrants | Philippines | 0.1 /100 | #274 | Tragic 96.3% |
| Immigrants | Ghana | 0.1 /100 | #275 | Tragic 96.3% |
| Yaqui | 0.1 /100 | #276 | Tragic 96.3% |
| Immigrants | Western Africa | 0.1 /100 | #277 | Tragic 96.3% |
| Immigrants | Thailand | 0.1 /100 | #278 | Tragic 96.3% |
| Immigrants | Peru | 0.1 /100 | #279 | Tragic 96.2% |
| Immigrants | Afghanistan | 0.1 /100 | #280 | Tragic 96.2% |
| Trinidadians and Tobagonians | 0.1 /100 | #281 | Tragic 96.2% |
| Houma | 0.1 /100 | #282 | Tragic 96.2% |