Korean vs Immigrants from Ghana Married-couple Households
COMPARE
Korean
Immigrants from Ghana
Married-couple Households
Married-couple Households Comparison
Koreans
Immigrants from Ghana
49.7%
MARRIED-COUPLE HOUSEHOLDS
99.9/ 100
METRIC RATING
15th/ 347
METRIC RANK
41.8%
MARRIED-COUPLE HOUSEHOLDS
0.0/ 100
METRIC RATING
299th/ 347
METRIC RANK
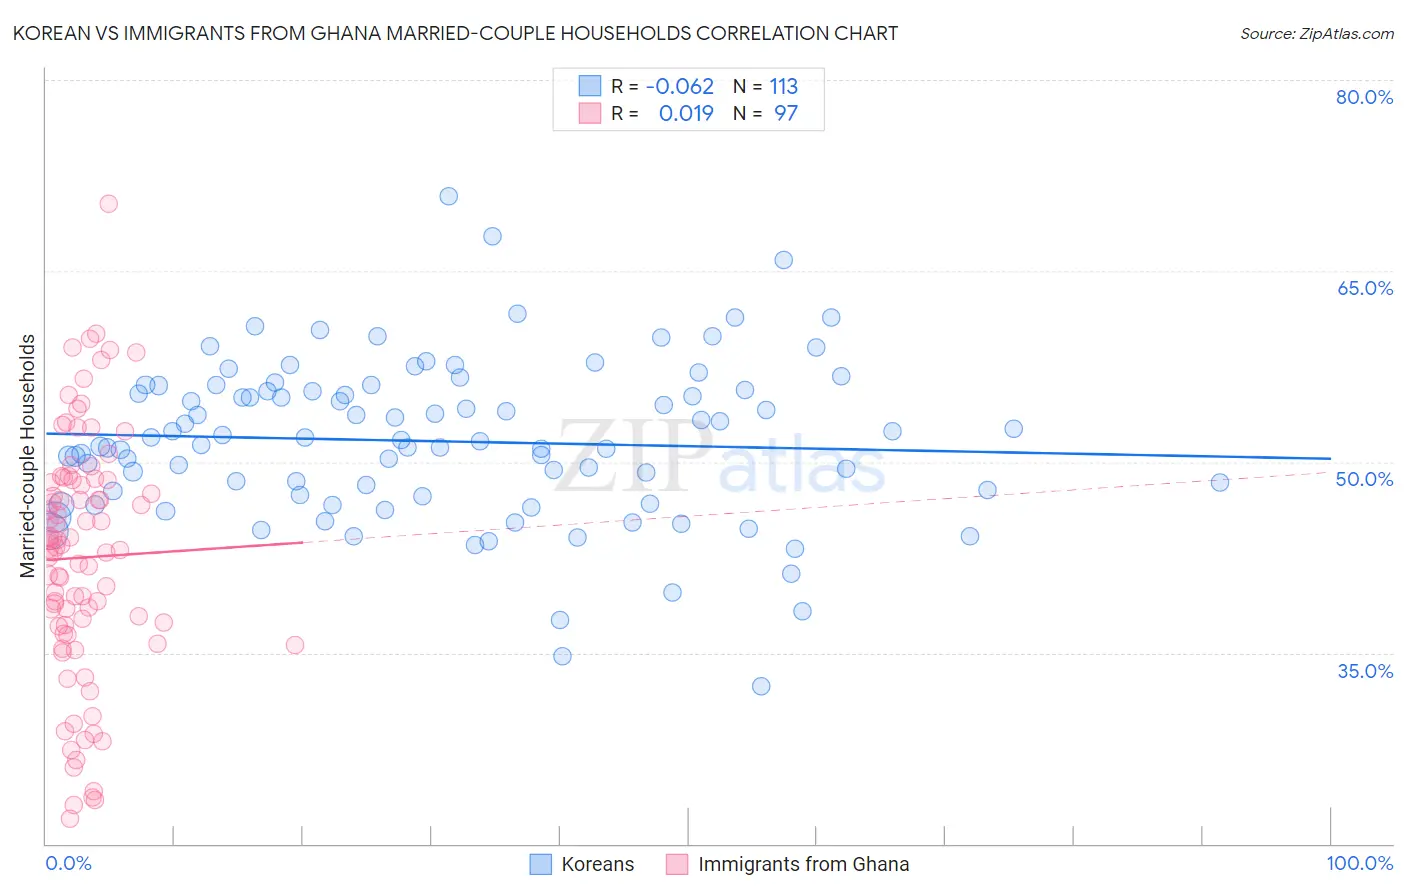
Korean vs Immigrants from Ghana Married-couple Households Correlation Chart
The statistical analysis conducted on geographies consisting of 510,373,209 people shows a slight negative correlation between the proportion of Koreans and percentage of married-couple family households in the United States with a correlation coefficient (R) of -0.062 and weighted average of 49.7%. Similarly, the statistical analysis conducted on geographies consisting of 199,796,188 people shows no correlation between the proportion of Immigrants from Ghana and percentage of married-couple family households in the United States with a correlation coefficient (R) of 0.019 and weighted average of 41.8%, a difference of 19.1%.
Married-couple Households Correlation Summary
| Measurement | Korean | Immigrants from Ghana |
| Minimum | 32.4% | 22.0% |
| Maximum | 70.8% | 70.3% |
| Range | 38.4% | 48.3% |
| Mean | 51.6% | 42.5% |
| Median | 51.7% | 43.2% |
| Interquartile 25% (IQ1) | 47.4% | 36.8% |
| Interquartile 75% (IQ3) | 55.6% | 48.6% |
| Interquartile Range (IQR) | 8.2% | 11.8% |
| Standard Deviation (Sample) | 6.3% | 9.6% |
| Standard Deviation (Population) | 6.3% | 9.6% |
Similar Demographics by Married-couple Households
Demographics Similar to Koreans by Married-couple Households
In terms of married-couple households, the demographic groups most similar to Koreans are Swedish (49.7%, a difference of 0.030%), Burmese (49.8%, a difference of 0.14%), Immigrants from Hong Kong (49.6%, a difference of 0.18%), English (49.6%, a difference of 0.19%), and Immigrants from Korea (49.9%, a difference of 0.27%).
| Demographics | Rating | Rank | Married-couple Households |
| Immigrants | South Central Asia | 100.0 /100 | #8 | Exceptional 50.6% |
| Pennsylvania Germans | 100.0 /100 | #9 | Exceptional 50.4% |
| Chinese | 100.0 /100 | #10 | Exceptional 50.4% |
| Immigrants | Pakistan | 100.0 /100 | #11 | Exceptional 50.1% |
| Swiss | 100.0 /100 | #12 | Exceptional 49.9% |
| Immigrants | Korea | 100.0 /100 | #13 | Exceptional 49.9% |
| Burmese | 100.0 /100 | #14 | Exceptional 49.8% |
| Koreans | 99.9 /100 | #15 | Exceptional 49.7% |
| Swedes | 99.9 /100 | #16 | Exceptional 49.7% |
| Immigrants | Hong Kong | 99.9 /100 | #17 | Exceptional 49.6% |
| English | 99.9 /100 | #18 | Exceptional 49.6% |
| Europeans | 99.9 /100 | #19 | Exceptional 49.6% |
| Scandinavians | 99.9 /100 | #20 | Exceptional 49.6% |
| Norwegians | 99.9 /100 | #21 | Exceptional 49.5% |
| Asians | 99.9 /100 | #22 | Exceptional 49.5% |
Demographics Similar to Immigrants from Ghana by Married-couple Households
In terms of married-couple households, the demographic groups most similar to Immigrants from Ghana are Immigrants from Belize (41.8%, a difference of 0.020%), Immigrants from Middle Africa (41.8%, a difference of 0.080%), Arapaho (41.8%, a difference of 0.11%), Immigrants from Bahamas (41.7%, a difference of 0.23%), and Immigrants from Honduras (41.6%, a difference of 0.40%).
| Demographics | Rating | Rank | Married-couple Households |
| Indonesians | 0.0 /100 | #292 | Tragic 42.0% |
| Menominee | 0.0 /100 | #293 | Tragic 42.0% |
| Immigrants | Yemen | 0.0 /100 | #294 | Tragic 42.0% |
| Kiowa | 0.0 /100 | #295 | Tragic 42.0% |
| Immigrants | Sudan | 0.0 /100 | #296 | Tragic 41.9% |
| Arapaho | 0.0 /100 | #297 | Tragic 41.8% |
| Immigrants | Middle Africa | 0.0 /100 | #298 | Tragic 41.8% |
| Immigrants | Ghana | 0.0 /100 | #299 | Tragic 41.8% |
| Immigrants | Belize | 0.0 /100 | #300 | Tragic 41.8% |
| Immigrants | Bahamas | 0.0 /100 | #301 | Tragic 41.7% |
| Immigrants | Honduras | 0.0 /100 | #302 | Tragic 41.6% |
| Sub-Saharan Africans | 0.0 /100 | #303 | Tragic 41.6% |
| Immigrants | Guyana | 0.0 /100 | #304 | Tragic 41.6% |
| Sioux | 0.0 /100 | #305 | Tragic 41.5% |
| Guyanese | 0.0 /100 | #306 | Tragic 41.4% |