Soviet Union vs Central American Indian Married-couple Households
COMPARE
Soviet Union
Central American Indian
Married-couple Households
Married-couple Households Comparison
Soviet Union
Central American Indians
44.6%
MARRIED-COUPLE HOUSEHOLDS
1.6/ 100
METRIC RATING
230th/ 347
METRIC RANK
43.8%
MARRIED-COUPLE HOUSEHOLDS
0.2/ 100
METRIC RATING
258th/ 347
METRIC RANK
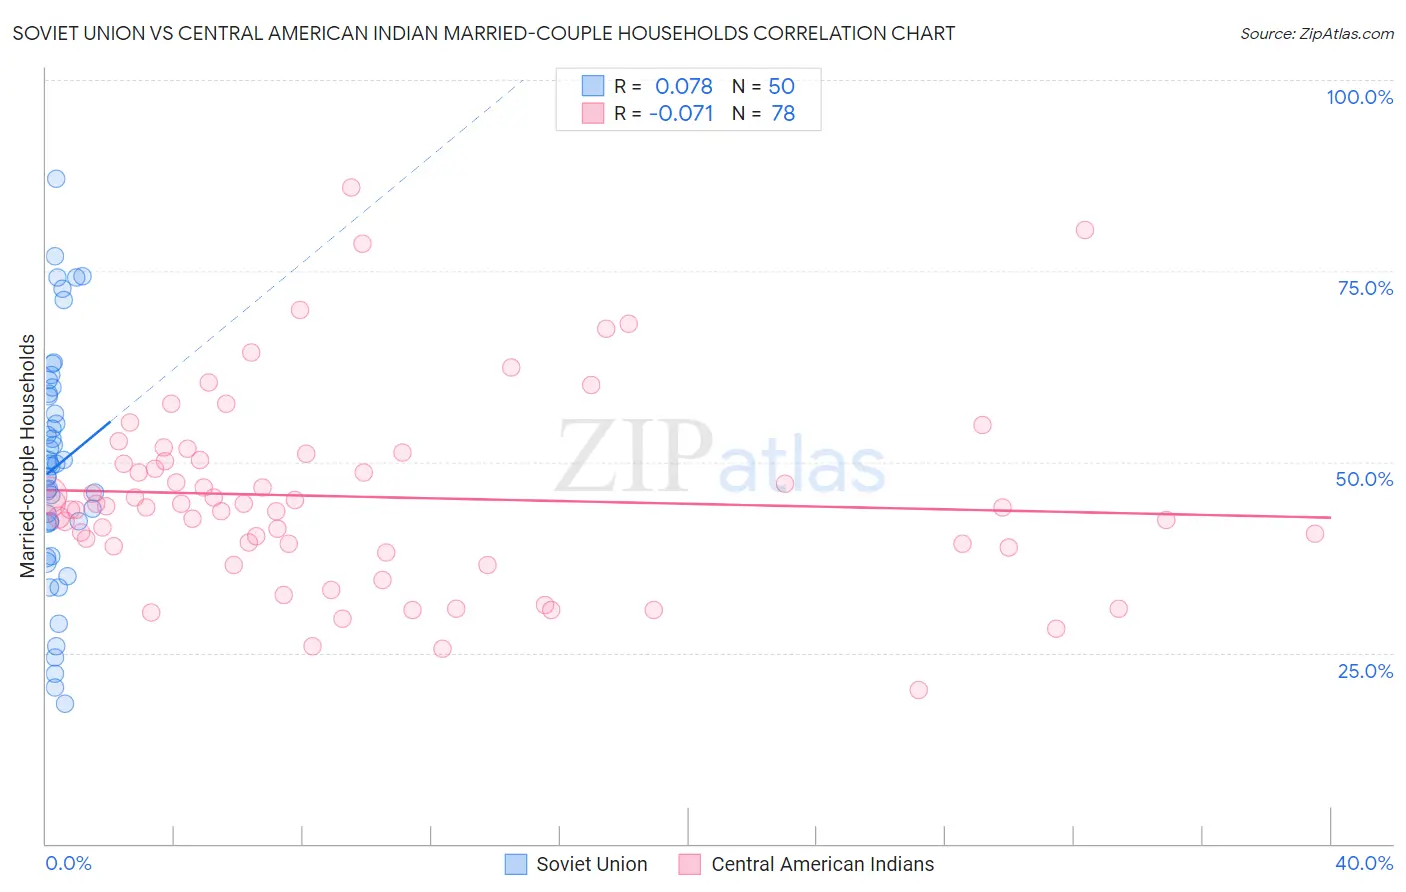
Soviet Union vs Central American Indian Married-couple Households Correlation Chart
The statistical analysis conducted on geographies consisting of 43,509,630 people shows a slight positive correlation between the proportion of Soviet Union and percentage of married-couple family households in the United States with a correlation coefficient (R) of 0.078 and weighted average of 44.6%. Similarly, the statistical analysis conducted on geographies consisting of 326,060,937 people shows a slight negative correlation between the proportion of Central American Indians and percentage of married-couple family households in the United States with a correlation coefficient (R) of -0.071 and weighted average of 43.8%, a difference of 2.0%.
Married-couple Households Correlation Summary
| Measurement | Soviet Union | Central American Indian |
| Minimum | 18.4% | 20.1% |
| Maximum | 87.0% | 86.0% |
| Range | 68.6% | 65.9% |
| Mean | 49.4% | 45.4% |
| Median | 49.6% | 44.1% |
| Interquartile 25% (IQ1) | 41.9% | 39.0% |
| Interquartile 75% (IQ3) | 58.9% | 50.2% |
| Interquartile Range (IQR) | 17.0% | 11.3% |
| Standard Deviation (Sample) | 15.5% | 12.5% |
| Standard Deviation (Population) | 15.3% | 12.4% |
Similar Demographics by Married-couple Households
Demographics Similar to Soviet Union by Married-couple Households
In terms of married-couple households, the demographic groups most similar to Soviet Union are Houma (44.6%, a difference of 0.010%), Marshallese (44.6%, a difference of 0.010%), Immigrants from Latin America (44.7%, a difference of 0.040%), Immigrants from Uganda (44.6%, a difference of 0.050%), and Kenyan (44.7%, a difference of 0.090%).
| Demographics | Rating | Rank | Married-couple Households |
| Immigrants | Cambodia | 2.7 /100 | #223 | Tragic 44.9% |
| Immigrants | Micronesia | 2.6 /100 | #224 | Tragic 44.9% |
| Dutch West Indians | 2.6 /100 | #225 | Tragic 44.9% |
| Alsatians | 2.3 /100 | #226 | Tragic 44.8% |
| Salvadorans | 1.9 /100 | #227 | Tragic 44.7% |
| Kenyans | 1.7 /100 | #228 | Tragic 44.7% |
| Immigrants | Latin America | 1.6 /100 | #229 | Tragic 44.7% |
| Soviet Union | 1.6 /100 | #230 | Tragic 44.6% |
| Houma | 1.5 /100 | #231 | Tragic 44.6% |
| Marshallese | 1.5 /100 | #232 | Tragic 44.6% |
| Immigrants | Uganda | 1.5 /100 | #233 | Tragic 44.6% |
| Immigrants | Panama | 1.3 /100 | #234 | Tragic 44.6% |
| Immigrants | Nicaragua | 1.2 /100 | #235 | Tragic 44.5% |
| Yaqui | 1.2 /100 | #236 | Tragic 44.5% |
| Comanche | 1.2 /100 | #237 | Tragic 44.5% |
Demographics Similar to Central American Indians by Married-couple Households
In terms of married-couple households, the demographic groups most similar to Central American Indians are Iroquois (43.7%, a difference of 0.030%), Blackfeet (43.8%, a difference of 0.040%), Immigrants from Cameroon (43.7%, a difference of 0.12%), Ugandan (43.8%, a difference of 0.20%), and Alaskan Athabascan (43.6%, a difference of 0.25%).
| Demographics | Rating | Rank | Married-couple Households |
| German Russians | 0.4 /100 | #251 | Tragic 44.0% |
| Seminole | 0.4 /100 | #252 | Tragic 44.0% |
| Central Americans | 0.3 /100 | #253 | Tragic 43.9% |
| Apache | 0.3 /100 | #254 | Tragic 43.9% |
| Shoshone | 0.3 /100 | #255 | Tragic 43.9% |
| Ugandans | 0.3 /100 | #256 | Tragic 43.8% |
| Blackfeet | 0.2 /100 | #257 | Tragic 43.8% |
| Central American Indians | 0.2 /100 | #258 | Tragic 43.8% |
| Iroquois | 0.2 /100 | #259 | Tragic 43.7% |
| Immigrants | Cameroon | 0.2 /100 | #260 | Tragic 43.7% |
| Alaskan Athabascans | 0.2 /100 | #261 | Tragic 43.6% |
| Vietnamese | 0.2 /100 | #262 | Tragic 43.6% |
| Cree | 0.1 /100 | #263 | Tragic 43.6% |
| Bangladeshis | 0.1 /100 | #264 | Tragic 43.5% |
| Moroccans | 0.1 /100 | #265 | Tragic 43.5% |