Native/Alaskan vs Central American Indian Married-couple Households
COMPARE
Native/Alaskan
Central American Indian
Married-couple Households
Married-couple Households Comparison
Natives/Alaskans
Central American Indians
43.5%
MARRIED-COUPLE HOUSEHOLDS
0.1/ 100
METRIC RATING
267th/ 347
METRIC RANK
43.8%
MARRIED-COUPLE HOUSEHOLDS
0.2/ 100
METRIC RATING
258th/ 347
METRIC RANK
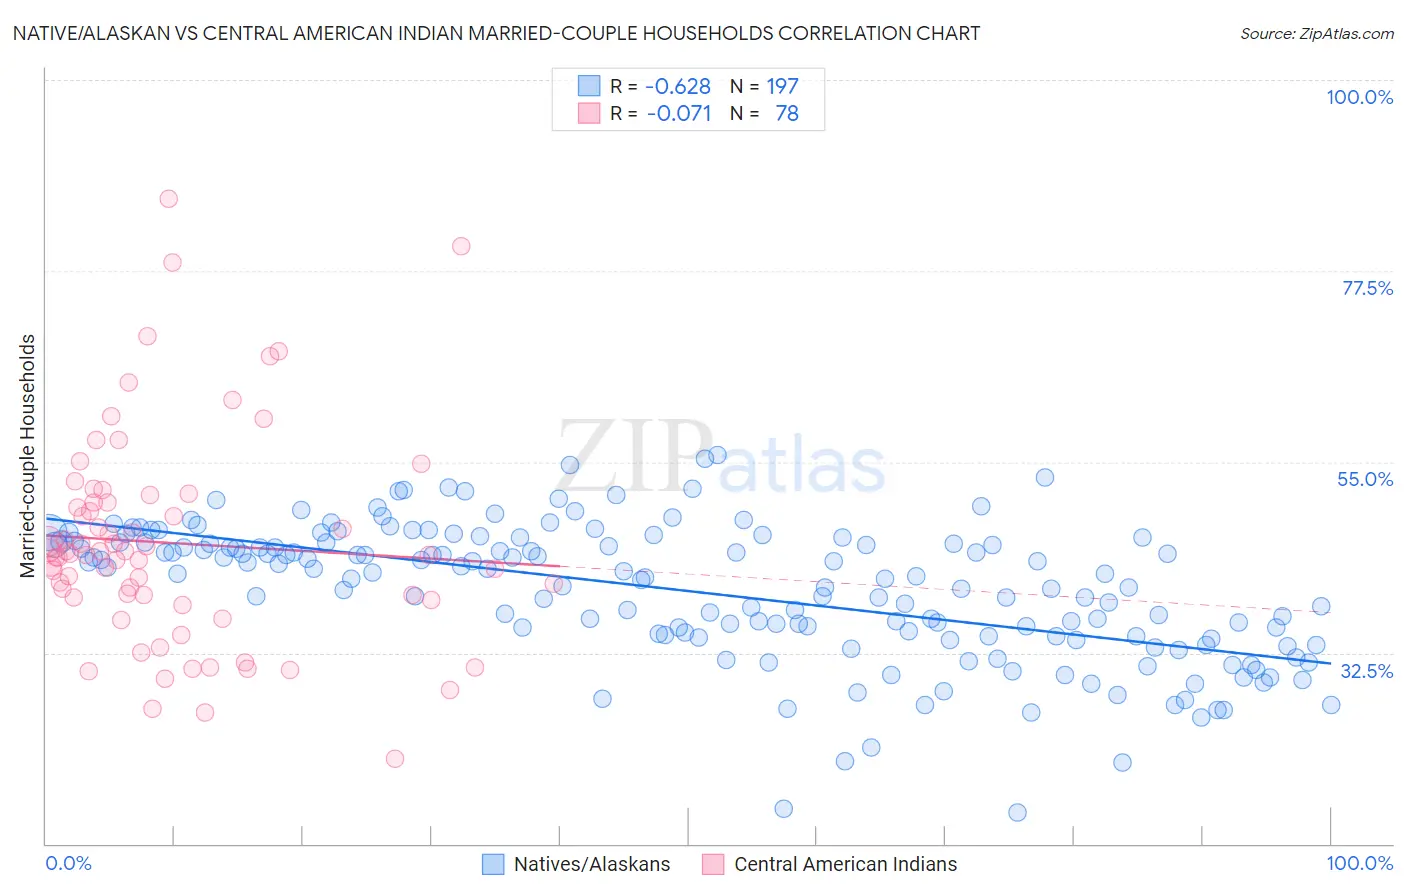
Native/Alaskan vs Central American Indian Married-couple Households Correlation Chart
The statistical analysis conducted on geographies consisting of 512,631,690 people shows a significant negative correlation between the proportion of Natives/Alaskans and percentage of married-couple family households in the United States with a correlation coefficient (R) of -0.628 and weighted average of 43.5%. Similarly, the statistical analysis conducted on geographies consisting of 326,060,937 people shows a slight negative correlation between the proportion of Central American Indians and percentage of married-couple family households in the United States with a correlation coefficient (R) of -0.071 and weighted average of 43.8%, a difference of 0.70%.
Married-couple Households Correlation Summary
| Measurement | Native/Alaskan | Central American Indian |
| Minimum | 13.8% | 20.1% |
| Maximum | 55.8% | 86.0% |
| Range | 42.1% | 65.9% |
| Mean | 39.8% | 45.4% |
| Median | 41.7% | 44.1% |
| Interquartile 25% (IQ1) | 34.5% | 39.0% |
| Interquartile 75% (IQ3) | 45.5% | 50.2% |
| Interquartile Range (IQR) | 11.0% | 11.3% |
| Standard Deviation (Sample) | 7.9% | 12.5% |
| Standard Deviation (Population) | 7.9% | 12.4% |
Demographics Similar to Natives/Alaskans and Central American Indians by Married-couple Households
In terms of married-couple households, the demographic groups most similar to Natives/Alaskans are Ecuadorian (43.5%, a difference of 0.050%), Moroccan (43.5%, a difference of 0.090%), Immigrants from Burma/Myanmar (43.4%, a difference of 0.10%), Bangladeshi (43.5%, a difference of 0.17%), and Cree (43.6%, a difference of 0.29%). Similarly, the demographic groups most similar to Central American Indians are Iroquois (43.7%, a difference of 0.030%), Blackfeet (43.8%, a difference of 0.040%), Immigrants from Cameroon (43.7%, a difference of 0.12%), Ugandan (43.8%, a difference of 0.20%), and Alaskan Athabascan (43.6%, a difference of 0.25%).
| Demographics | Rating | Rank | Married-couple Households |
| Seminole | 0.4 /100 | #252 | Tragic 44.0% |
| Central Americans | 0.3 /100 | #253 | Tragic 43.9% |
| Apache | 0.3 /100 | #254 | Tragic 43.9% |
| Shoshone | 0.3 /100 | #255 | Tragic 43.9% |
| Ugandans | 0.3 /100 | #256 | Tragic 43.8% |
| Blackfeet | 0.2 /100 | #257 | Tragic 43.8% |
| Central American Indians | 0.2 /100 | #258 | Tragic 43.8% |
| Iroquois | 0.2 /100 | #259 | Tragic 43.7% |
| Immigrants | Cameroon | 0.2 /100 | #260 | Tragic 43.7% |
| Alaskan Athabascans | 0.2 /100 | #261 | Tragic 43.6% |
| Vietnamese | 0.2 /100 | #262 | Tragic 43.6% |
| Cree | 0.1 /100 | #263 | Tragic 43.6% |
| Bangladeshis | 0.1 /100 | #264 | Tragic 43.5% |
| Moroccans | 0.1 /100 | #265 | Tragic 43.5% |
| Ecuadorians | 0.1 /100 | #266 | Tragic 43.5% |
| Natives/Alaskans | 0.1 /100 | #267 | Tragic 43.5% |
| Immigrants | Burma/Myanmar | 0.1 /100 | #268 | Tragic 43.4% |
| Immigrants | Sierra Leone | 0.1 /100 | #269 | Tragic 43.3% |
| Yuman | 0.1 /100 | #270 | Tragic 43.3% |
| Guatemalans | 0.1 /100 | #271 | Tragic 43.3% |
| Immigrants | Nigeria | 0.1 /100 | #272 | Tragic 43.2% |