Soviet Union vs Central American Indian Female Disability
COMPARE
Soviet Union
Central American Indian
Female Disability
Female Disability Comparison
Soviet Union
Central American Indians
11.7%
FEMALE DISABILITY
98.1/ 100
METRIC RATING
110th/ 347
METRIC RANK
13.6%
FEMALE DISABILITY
0.0/ 100
METRIC RATING
307th/ 347
METRIC RANK
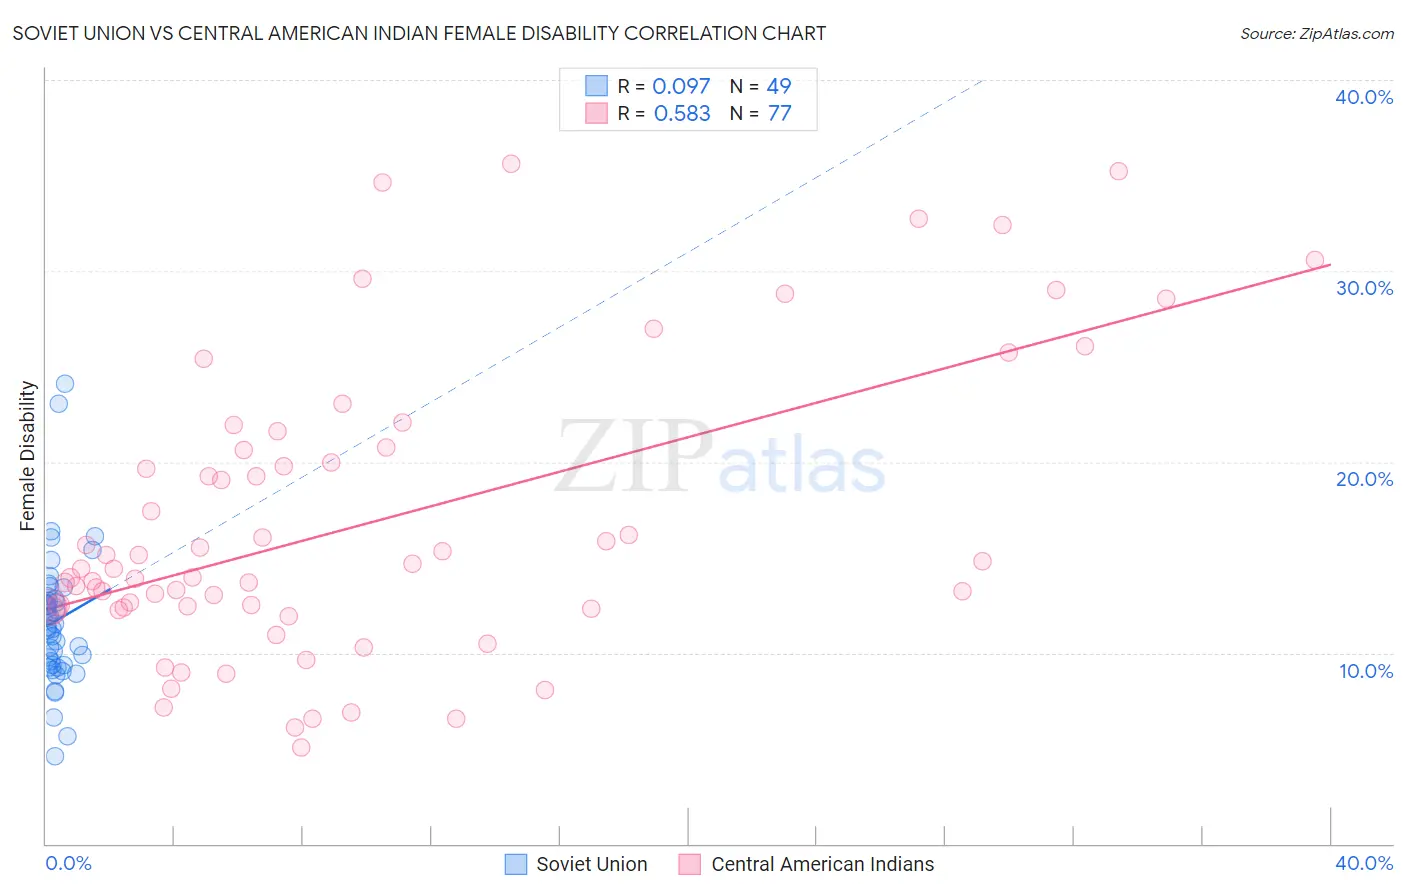
Soviet Union vs Central American Indian Female Disability Correlation Chart
The statistical analysis conducted on geographies consisting of 43,504,651 people shows a slight positive correlation between the proportion of Soviet Union and percentage of females with a disability in the United States with a correlation coefficient (R) of 0.097 and weighted average of 11.7%. Similarly, the statistical analysis conducted on geographies consisting of 326,112,462 people shows a substantial positive correlation between the proportion of Central American Indians and percentage of females with a disability in the United States with a correlation coefficient (R) of 0.583 and weighted average of 13.6%, a difference of 16.0%.
Female Disability Correlation Summary
| Measurement | Soviet Union | Central American Indian |
| Minimum | 4.6% | 5.1% |
| Maximum | 24.1% | 35.6% |
| Range | 19.5% | 30.5% |
| Mean | 11.7% | 16.8% |
| Median | 11.3% | 14.4% |
| Interquartile 25% (IQ1) | 9.3% | 12.3% |
| Interquartile 75% (IQ3) | 12.9% | 20.7% |
| Interquartile Range (IQR) | 3.5% | 8.3% |
| Standard Deviation (Sample) | 3.5% | 7.6% |
| Standard Deviation (Population) | 3.5% | 7.5% |
Similar Demographics by Female Disability
Demographics Similar to Soviet Union by Female Disability
In terms of female disability, the demographic groups most similar to Soviet Union are Immigrants (11.7%, a difference of 0.0%), Costa Rican (11.7%, a difference of 0.020%), New Zealander (11.7%, a difference of 0.030%), Latvian (11.7%, a difference of 0.050%), and Immigrants from Greece (11.7%, a difference of 0.080%).
| Demographics | Rating | Rank | Female Disability |
| Immigrants | Eastern Africa | 98.3 /100 | #103 | Exceptional 11.7% |
| Immigrants | Western Asia | 98.3 /100 | #104 | Exceptional 11.7% |
| Australians | 98.3 /100 | #105 | Exceptional 11.7% |
| Immigrants | Greece | 98.2 /100 | #106 | Exceptional 11.7% |
| Latvians | 98.2 /100 | #107 | Exceptional 11.7% |
| New Zealanders | 98.1 /100 | #108 | Exceptional 11.7% |
| Immigrants | Immigrants | 98.1 /100 | #109 | Exceptional 11.7% |
| Soviet Union | 98.1 /100 | #110 | Exceptional 11.7% |
| Costa Ricans | 98.1 /100 | #111 | Exceptional 11.7% |
| Immigrants | Bangladesh | 97.8 /100 | #112 | Exceptional 11.8% |
| Immigrants | Belarus | 97.8 /100 | #113 | Exceptional 11.8% |
| South Africans | 97.7 /100 | #114 | Exceptional 11.8% |
| Brazilians | 97.7 /100 | #115 | Exceptional 11.8% |
| Immigrants | Morocco | 97.6 /100 | #116 | Exceptional 11.8% |
| Immigrants | Eastern Europe | 97.2 /100 | #117 | Exceptional 11.8% |
Demographics Similar to Central American Indians by Female Disability
In terms of female disability, the demographic groups most similar to Central American Indians are French Canadian (13.6%, a difference of 0.29%), Cree (13.7%, a difference of 0.46%), French American Indian (13.7%, a difference of 0.52%), Apache (13.7%, a difference of 0.63%), and Dominican (13.5%, a difference of 0.92%).
| Demographics | Rating | Rank | Female Disability |
| Pennsylvania Germans | 0.0 /100 | #300 | Tragic 13.4% |
| Africans | 0.0 /100 | #301 | Tragic 13.4% |
| Scotch-Irish | 0.0 /100 | #302 | Tragic 13.4% |
| Immigrants | Portugal | 0.0 /100 | #303 | Tragic 13.5% |
| Immigrants | Micronesia | 0.0 /100 | #304 | Tragic 13.5% |
| Dominicans | 0.0 /100 | #305 | Tragic 13.5% |
| French Canadians | 0.0 /100 | #306 | Tragic 13.6% |
| Central American Indians | 0.0 /100 | #307 | Tragic 13.6% |
| Cree | 0.0 /100 | #308 | Tragic 13.7% |
| French American Indians | 0.0 /100 | #309 | Tragic 13.7% |
| Apache | 0.0 /100 | #310 | Tragic 13.7% |
| Hopi | 0.0 /100 | #311 | Tragic 13.7% |
| Delaware | 0.0 /100 | #312 | Tragic 13.8% |
| Blackfeet | 0.0 /100 | #313 | Tragic 13.8% |
| Puget Sound Salish | 0.0 /100 | #314 | Tragic 13.8% |