Irish vs Immigrants from Guyana Average Family Size
COMPARE
Irish
Immigrants from Guyana
Average Family Size
Average Family Size Comparison
Irish
Immigrants from Guyana
3.10
AVERAGE FAMILY SIZE
0.0/ 100
METRIC RATING
336th/ 347
METRIC RANK
3.40
AVERAGE FAMILY SIZE
100.0/ 100
METRIC RATING
36th/ 347
METRIC RANK
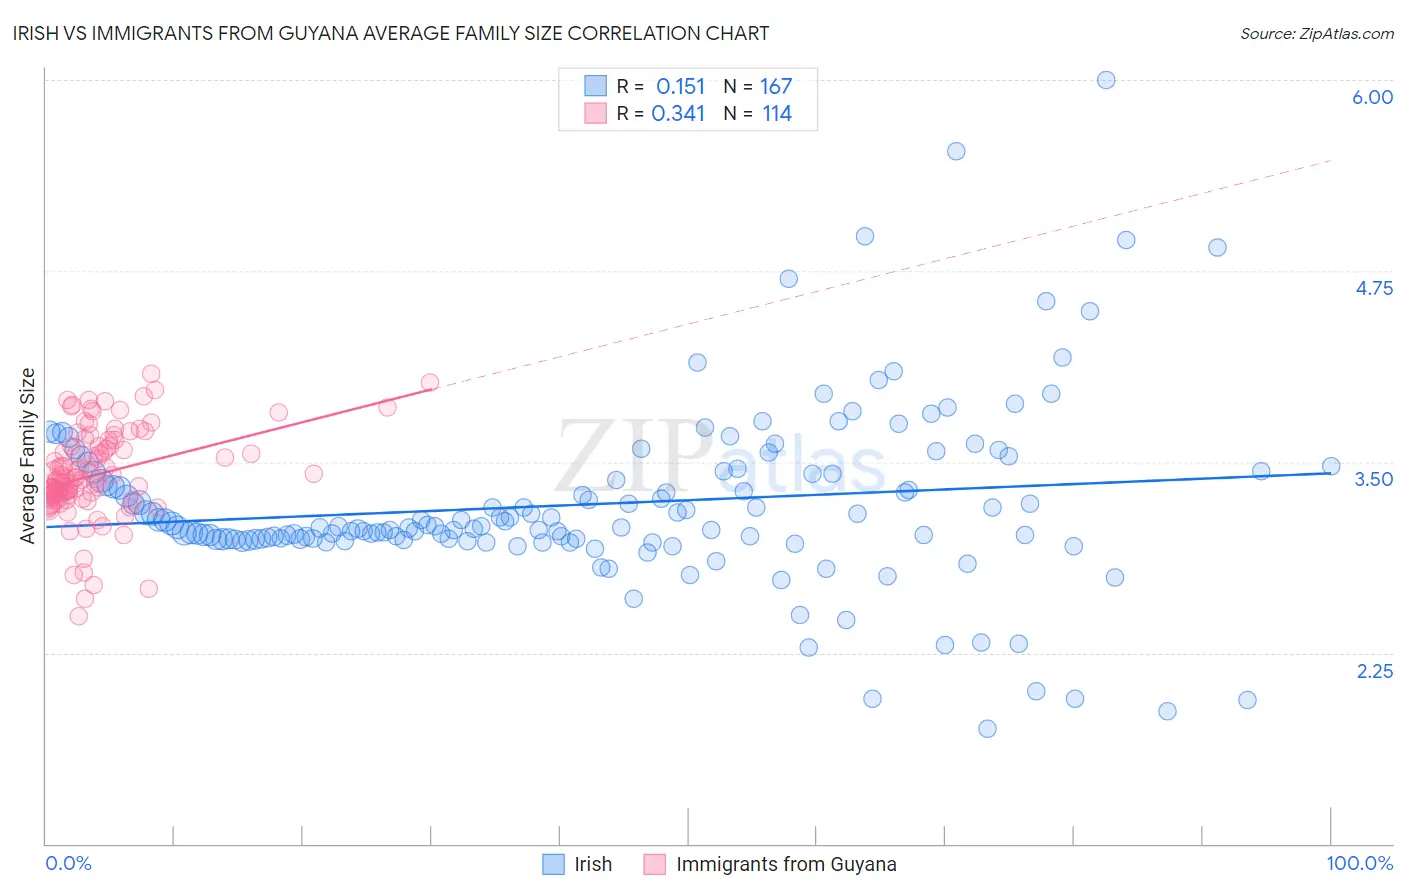
Irish vs Immigrants from Guyana Average Family Size Correlation Chart
The statistical analysis conducted on geographies consisting of 580,016,096 people shows a poor positive correlation between the proportion of Irish and average family size in the United States with a correlation coefficient (R) of 0.151 and weighted average of 3.10. Similarly, the statistical analysis conducted on geographies consisting of 183,692,650 people shows a mild positive correlation between the proportion of Immigrants from Guyana and average family size in the United States with a correlation coefficient (R) of 0.341 and weighted average of 3.40, a difference of 9.8%.
Average Family Size Correlation Summary
| Measurement | Irish | Immigrants from Guyana |
| Minimum | 1.75 | 2.49 |
| Maximum | 6.00 | 4.08 |
| Range | 4.25 | 1.59 |
| Mean | 3.22 | 3.42 |
| Median | 3.08 | 3.38 |
| Interquartile 25% (IQ1) | 2.99 | 3.27 |
| Interquartile 75% (IQ3) | 3.43 | 3.60 |
| Interquartile Range (IQR) | 0.44 | 0.33 |
| Standard Deviation (Sample) | 0.59 | 0.30 |
| Standard Deviation (Population) | 0.59 | 0.30 |
Similar Demographics by Average Family Size
Demographics Similar to Irish by Average Family Size
In terms of average family size, the demographic groups most similar to Irish are Swedish (3.10, a difference of 0.030%), Luxembourger (3.10, a difference of 0.060%), French (3.10, a difference of 0.060%), Croatian (3.10, a difference of 0.070%), and Estonian (3.10, a difference of 0.090%).
| Demographics | Rating | Rank | Average Family Size |
| Belgians | 0.0 /100 | #329 | Tragic 3.11 |
| Latvians | 0.0 /100 | #330 | Tragic 3.11 |
| Scotch-Irish | 0.0 /100 | #331 | Tragic 3.11 |
| Scottish | 0.0 /100 | #332 | Tragic 3.11 |
| Estonians | 0.0 /100 | #333 | Tragic 3.10 |
| Lithuanians | 0.0 /100 | #334 | Tragic 3.10 |
| Luxembourgers | 0.0 /100 | #335 | Tragic 3.10 |
| Irish | 0.0 /100 | #336 | Tragic 3.10 |
| Swedes | 0.0 /100 | #337 | Tragic 3.10 |
| French | 0.0 /100 | #338 | Tragic 3.10 |
| Croatians | 0.0 /100 | #339 | Tragic 3.10 |
| Finns | 0.0 /100 | #340 | Tragic 3.09 |
| Poles | 0.0 /100 | #341 | Tragic 3.09 |
| Germans | 0.0 /100 | #342 | Tragic 3.09 |
| Norwegians | 0.0 /100 | #343 | Tragic 3.08 |
Demographics Similar to Immigrants from Guyana by Average Family Size
In terms of average family size, the demographic groups most similar to Immigrants from Guyana are Guatemalan (3.40, a difference of 0.050%), Hispanic or Latino (3.41, a difference of 0.11%), Guyanese (3.40, a difference of 0.14%), Hawaiian (3.41, a difference of 0.16%), and Immigrants from Guatemala (3.41, a difference of 0.19%).
| Demographics | Rating | Rank | Average Family Size |
| Nepalese | 100.0 /100 | #29 | Exceptional 3.42 |
| Samoans | 100.0 /100 | #30 | Exceptional 3.42 |
| Central Americans | 100.0 /100 | #31 | Exceptional 3.41 |
| Immigrants | Guatemala | 100.0 /100 | #32 | Exceptional 3.41 |
| Hawaiians | 100.0 /100 | #33 | Exceptional 3.41 |
| Hispanics or Latinos | 100.0 /100 | #34 | Exceptional 3.41 |
| Guatemalans | 100.0 /100 | #35 | Exceptional 3.40 |
| Immigrants | Guyana | 100.0 /100 | #36 | Exceptional 3.40 |
| Guyanese | 100.0 /100 | #37 | Exceptional 3.40 |
| Immigrants | Belize | 100.0 /100 | #38 | Exceptional 3.39 |
| Immigrants | Haiti | 100.0 /100 | #39 | Exceptional 3.39 |
| Belizeans | 100.0 /100 | #40 | Exceptional 3.39 |
| Marshallese | 100.0 /100 | #41 | Exceptional 3.38 |
| Immigrants | Vietnam | 100.0 /100 | #42 | Exceptional 3.38 |
| Immigrants | Philippines | 100.0 /100 | #43 | Exceptional 3.37 |