Immigrants from South America vs Immigrants from Guyana Average Family Size
COMPARE
Immigrants from South America
Immigrants from Guyana
Average Family Size
Average Family Size Comparison
Immigrants from South America
Immigrants from Guyana
3.27
AVERAGE FAMILY SIZE
95.0/ 100
METRIC RATING
116th/ 347
METRIC RANK
3.40
AVERAGE FAMILY SIZE
100.0/ 100
METRIC RATING
36th/ 347
METRIC RANK
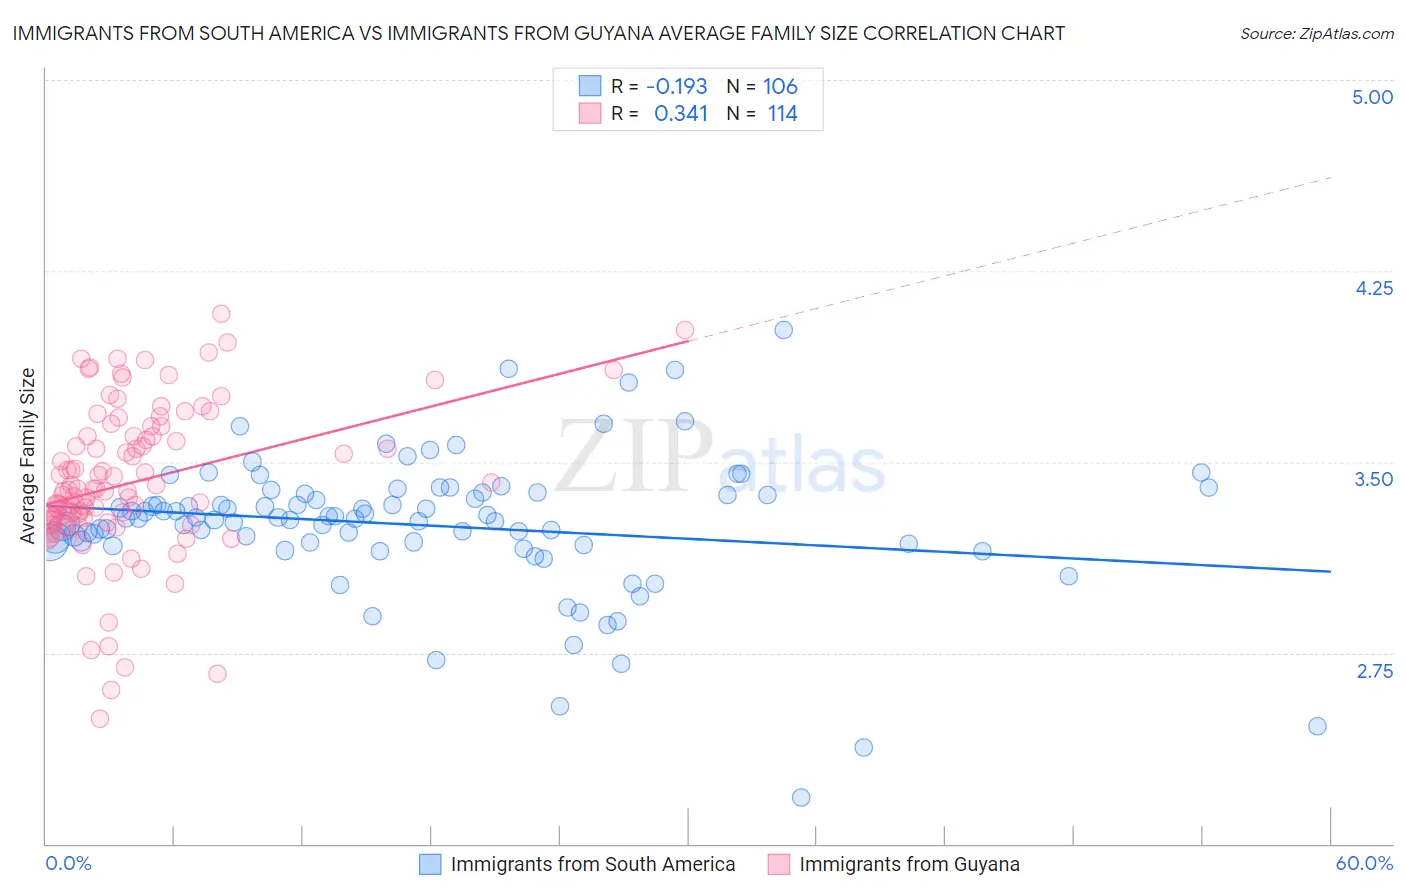
Immigrants from South America vs Immigrants from Guyana Average Family Size Correlation Chart
The statistical analysis conducted on geographies consisting of 486,031,470 people shows a poor negative correlation between the proportion of Immigrants from South America and average family size in the United States with a correlation coefficient (R) of -0.193 and weighted average of 3.27. Similarly, the statistical analysis conducted on geographies consisting of 183,692,650 people shows a mild positive correlation between the proportion of Immigrants from Guyana and average family size in the United States with a correlation coefficient (R) of 0.341 and weighted average of 3.40, a difference of 4.0%.
Average Family Size Correlation Summary
| Measurement | Immigrants from South America | Immigrants from Guyana |
| Minimum | 2.18 | 2.49 |
| Maximum | 4.02 | 4.08 |
| Range | 1.84 | 1.59 |
| Mean | 3.25 | 3.42 |
| Median | 3.28 | 3.38 |
| Interquartile 25% (IQ1) | 3.18 | 3.27 |
| Interquartile 75% (IQ3) | 3.37 | 3.60 |
| Interquartile Range (IQR) | 0.19 | 0.33 |
| Standard Deviation (Sample) | 0.28 | 0.30 |
| Standard Deviation (Population) | 0.27 | 0.30 |
Similar Demographics by Average Family Size
Demographics Similar to Immigrants from South America by Average Family Size
In terms of average family size, the demographic groups most similar to Immigrants from South America are Immigrants from Liberia (3.27, a difference of 0.0%), South American (3.27, a difference of 0.010%), Kiowa (3.27, a difference of 0.020%), Immigrants from Panama (3.27, a difference of 0.060%), and Black/African American (3.27, a difference of 0.070%).
| Demographics | Rating | Rank | Average Family Size |
| Puerto Ricans | 96.7 /100 | #109 | Exceptional 3.28 |
| Bahamians | 96.6 /100 | #110 | Exceptional 3.28 |
| Indonesians | 96.2 /100 | #111 | Exceptional 3.28 |
| Blacks/African Americans | 95.7 /100 | #112 | Exceptional 3.27 |
| Immigrants | Panama | 95.6 /100 | #113 | Exceptional 3.27 |
| South Americans | 95.1 /100 | #114 | Exceptional 3.27 |
| Immigrants | Liberia | 95.0 /100 | #115 | Exceptional 3.27 |
| Immigrants | South America | 95.0 /100 | #116 | Exceptional 3.27 |
| Kiowa | 94.8 /100 | #117 | Exceptional 3.27 |
| Immigrants | Asia | 94.0 /100 | #118 | Exceptional 3.27 |
| Immigrants | Indonesia | 93.7 /100 | #119 | Exceptional 3.27 |
| Immigrants | Bahamas | 93.6 /100 | #120 | Exceptional 3.27 |
| Immigrants | Thailand | 93.3 /100 | #121 | Exceptional 3.27 |
| Immigrants | Colombia | 92.8 /100 | #122 | Exceptional 3.27 |
| Alaskan Athabascans | 92.4 /100 | #123 | Exceptional 3.27 |
Demographics Similar to Immigrants from Guyana by Average Family Size
In terms of average family size, the demographic groups most similar to Immigrants from Guyana are Guatemalan (3.40, a difference of 0.050%), Hispanic or Latino (3.41, a difference of 0.11%), Guyanese (3.40, a difference of 0.14%), Hawaiian (3.41, a difference of 0.16%), and Immigrants from Guatemala (3.41, a difference of 0.19%).
| Demographics | Rating | Rank | Average Family Size |
| Nepalese | 100.0 /100 | #29 | Exceptional 3.42 |
| Samoans | 100.0 /100 | #30 | Exceptional 3.42 |
| Central Americans | 100.0 /100 | #31 | Exceptional 3.41 |
| Immigrants | Guatemala | 100.0 /100 | #32 | Exceptional 3.41 |
| Hawaiians | 100.0 /100 | #33 | Exceptional 3.41 |
| Hispanics or Latinos | 100.0 /100 | #34 | Exceptional 3.41 |
| Guatemalans | 100.0 /100 | #35 | Exceptional 3.40 |
| Immigrants | Guyana | 100.0 /100 | #36 | Exceptional 3.40 |
| Guyanese | 100.0 /100 | #37 | Exceptional 3.40 |
| Immigrants | Belize | 100.0 /100 | #38 | Exceptional 3.39 |
| Immigrants | Haiti | 100.0 /100 | #39 | Exceptional 3.39 |
| Belizeans | 100.0 /100 | #40 | Exceptional 3.39 |
| Marshallese | 100.0 /100 | #41 | Exceptional 3.38 |
| Immigrants | Vietnam | 100.0 /100 | #42 | Exceptional 3.38 |
| Immigrants | Philippines | 100.0 /100 | #43 | Exceptional 3.37 |